

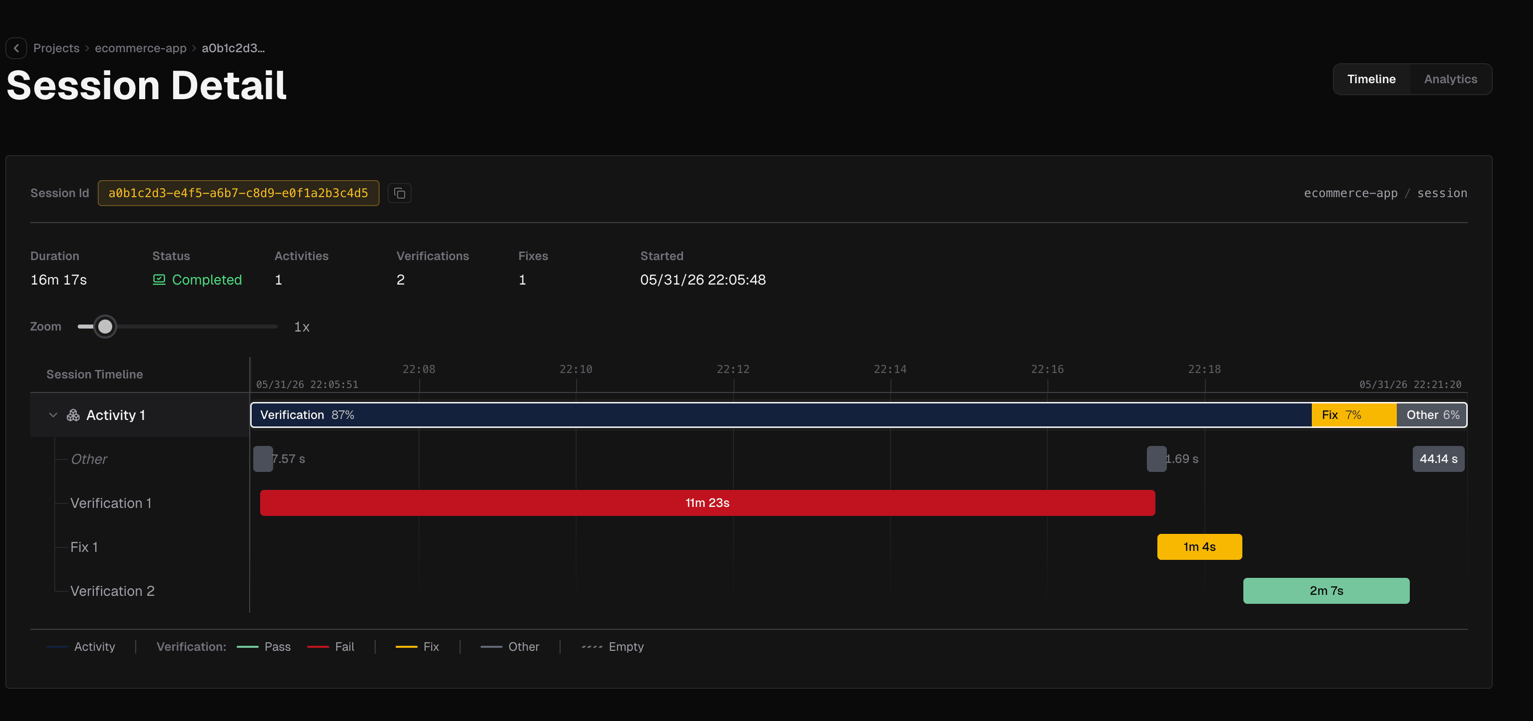
Chart layout
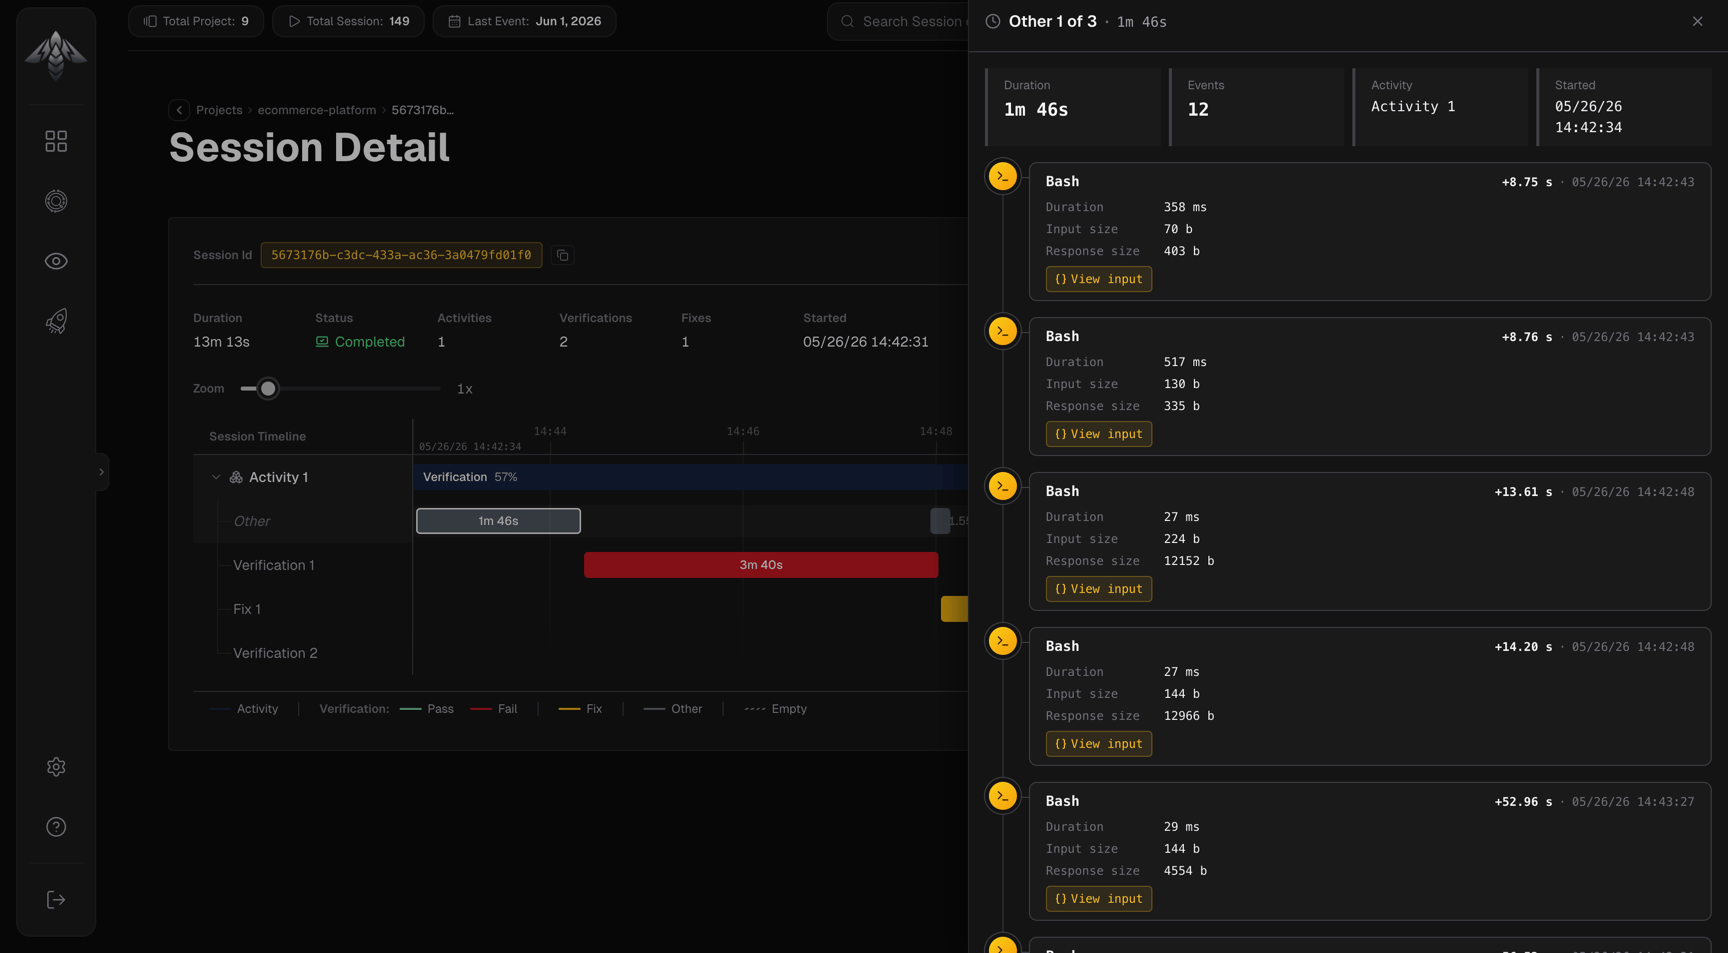
The chart is split into two synchronized columns: Left Labels column Lists each activity as a row: Activity 1, Activity 2, and so on. Click a row to expand it and reveal its nested child rows: verifications, fixes, and other intervals that belong to that activity. The expanded state is indicated by a chevron icon. Right Chart area Scrollable horizontally. Each row in the labels column has a corresponding colored interval bar in the chart area. Nested child bars appear below their parent when the activity is expanded. Tick marks and an axis row at the top show the time scale.Interactions
- Click an interval bar selects it and opens a detail panel on the right side
- Drag horizontally pans the chart
- Zoom slider adjusts the time scale
Detail panels
Clicking an interval opens one of four panels depending on what was clicked:Verification panel
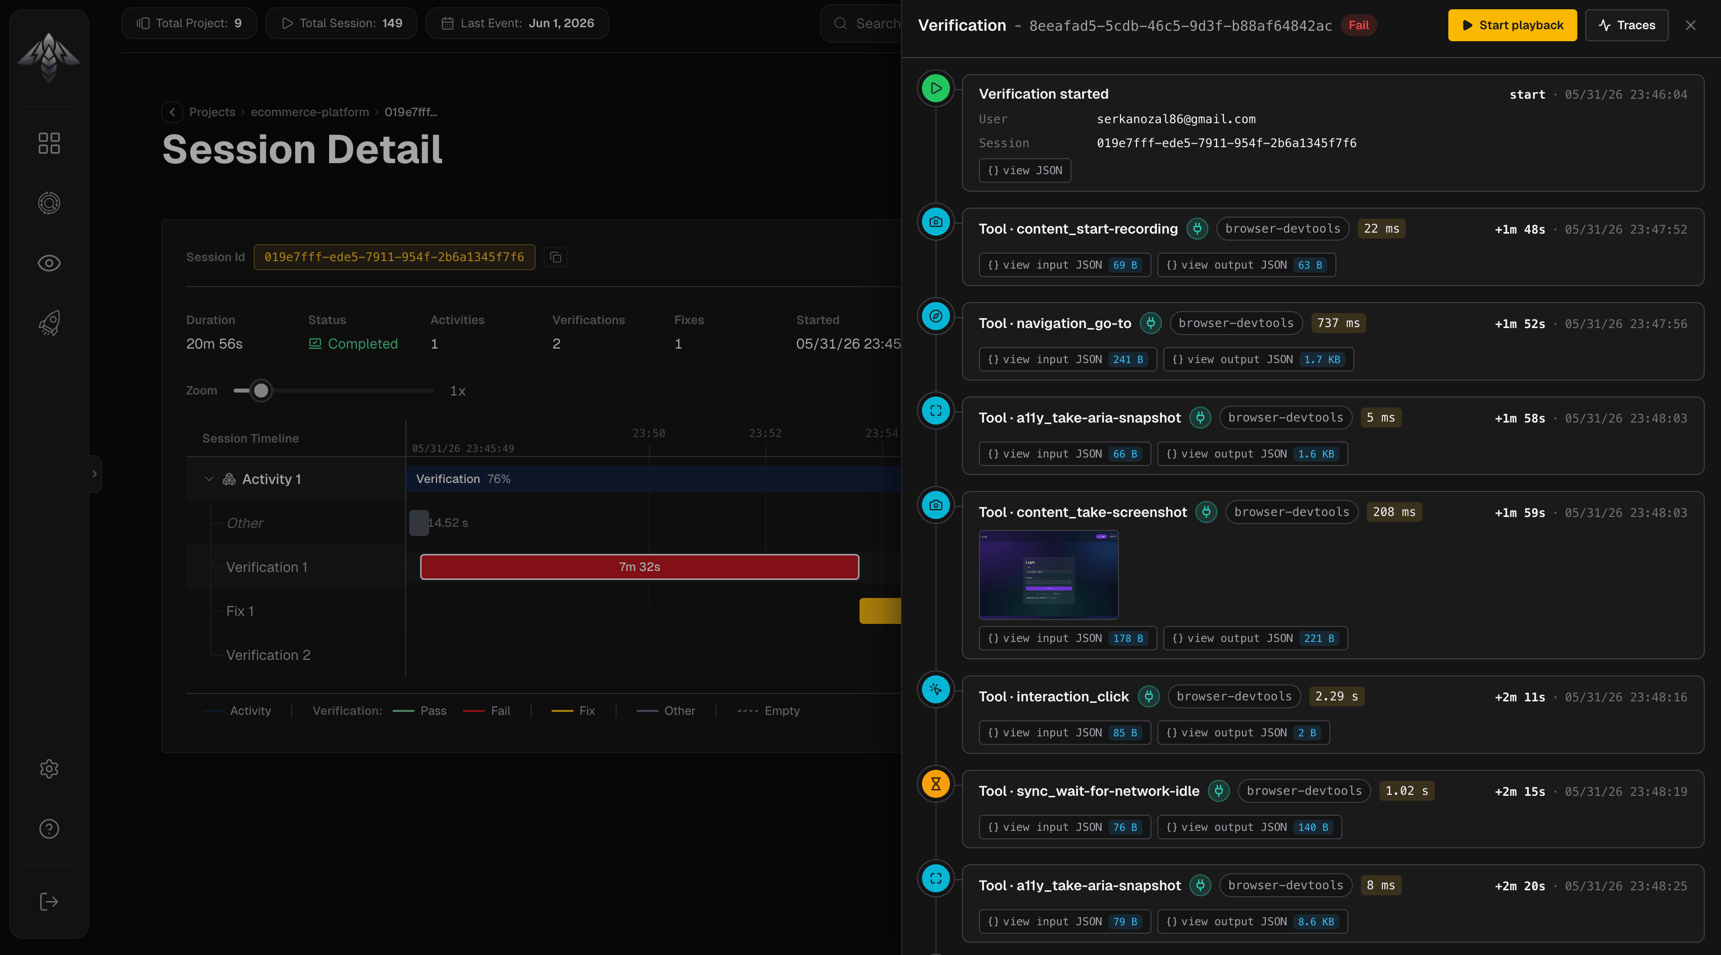
- Verdict (pass or fail)
- Checks the agent confirmed
- Issues reported (on fail)
- Fixes applied (on a passing retry)
- Trace data for the cycle
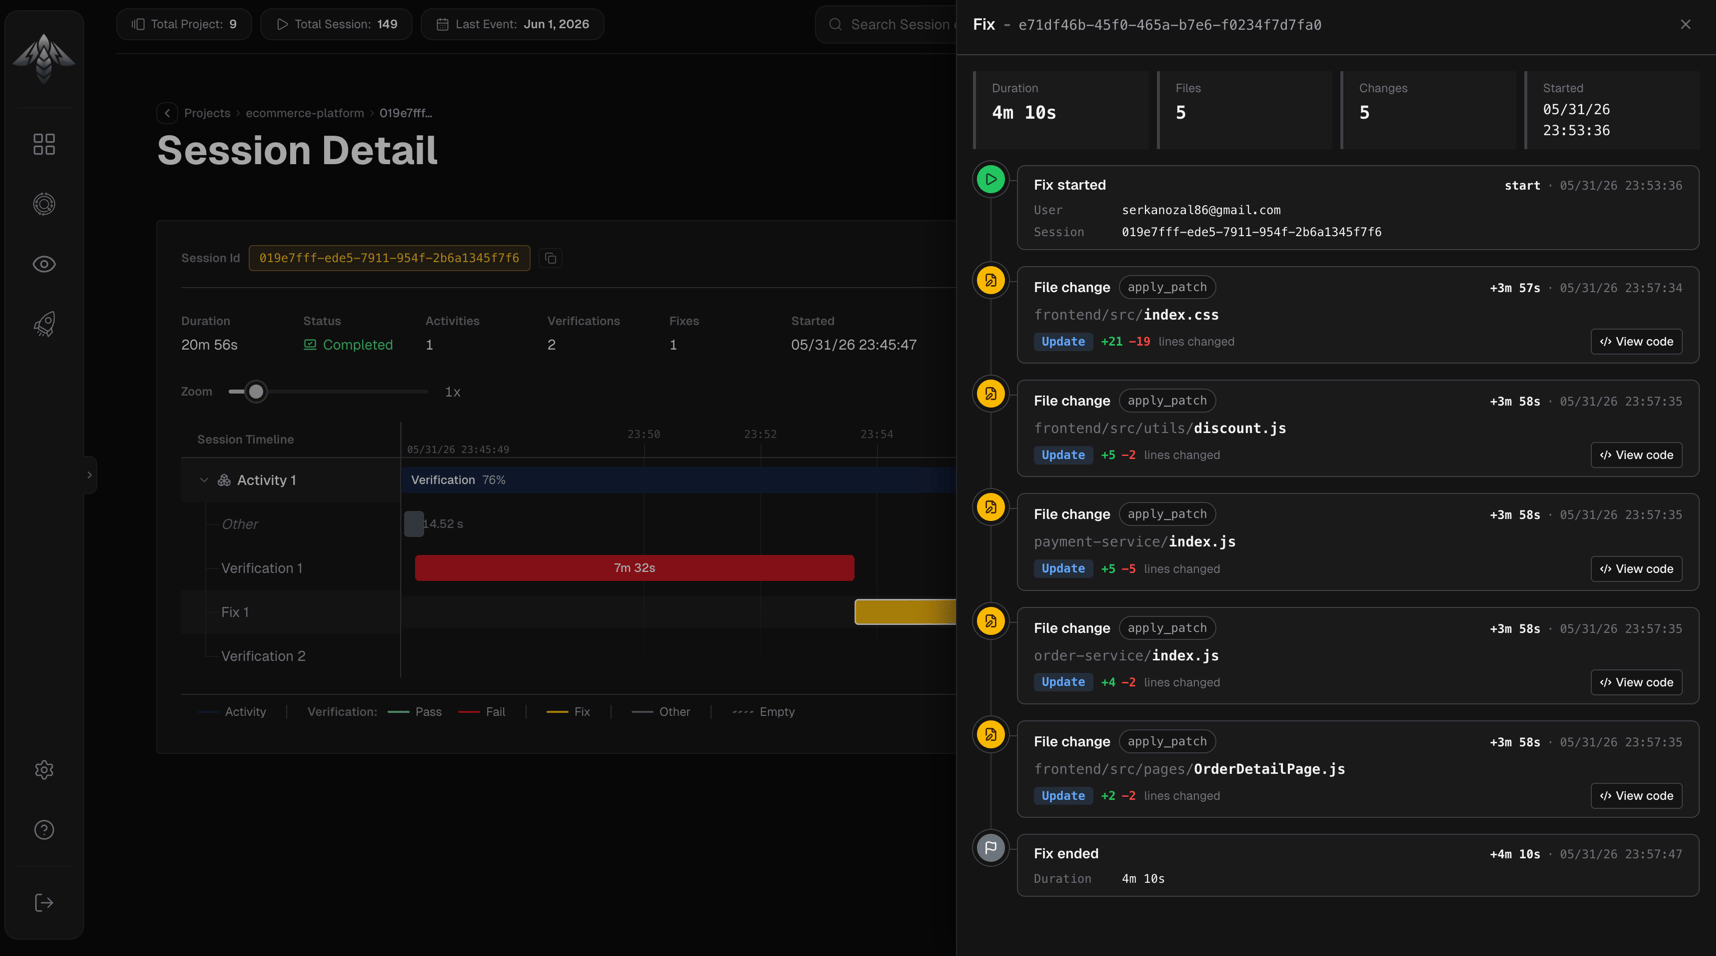
Fix panel
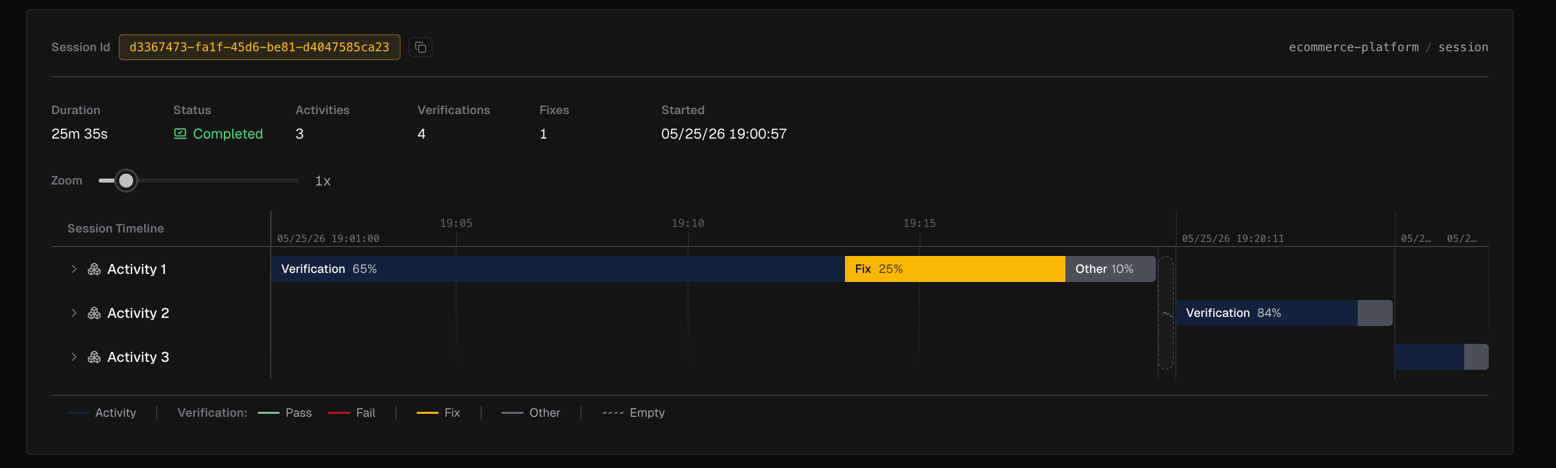
Activity panel
Other panel
Related pages
Verifications
Verification cycles with evidence and verdicts.
Fixes
Code changes the agent made to resolve failures.