How to access traces
Traces are embedded in the Verification Detail panel, they are not a standalone page.- Open a session and go to the Timeline tab
- Click a verification event in the timeline to open the Verification panel
- Click the Traces button in the verification header
tracesOpen=true so you can link directly to it.
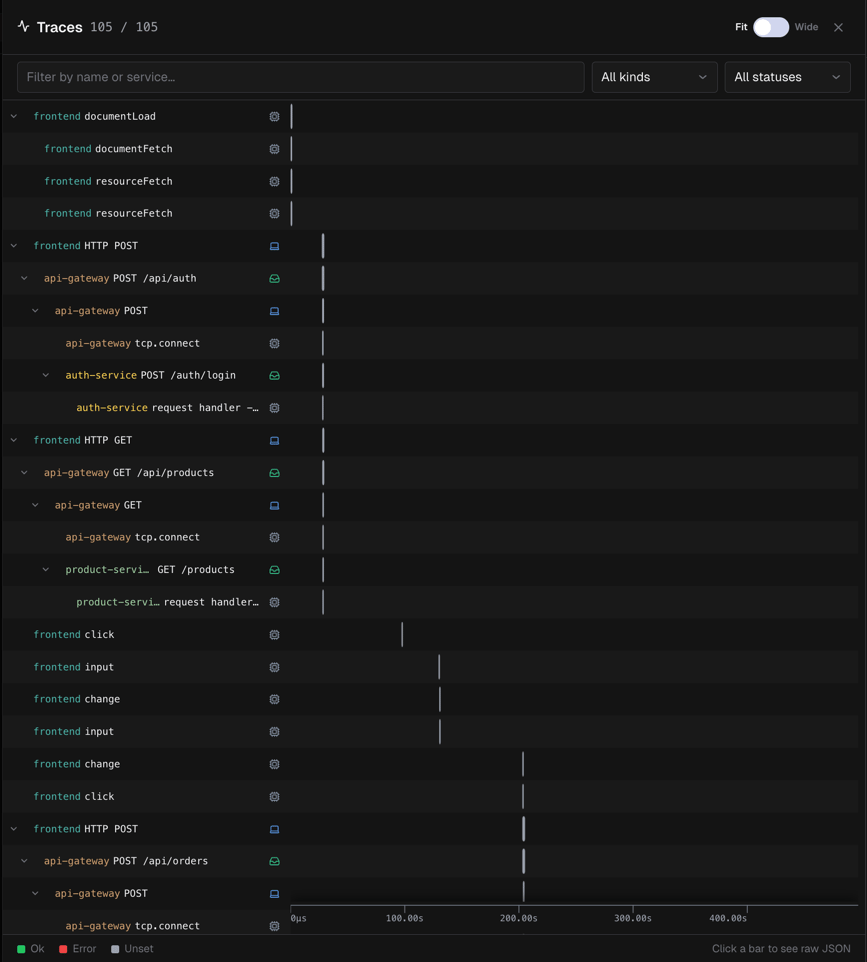
Traces panel
The panel header shows a count badge, for example5 / 12 means 5 spans match the current filters out of 12 total.
View toggle
| Mode | Behavior |
|---|---|
| Fit | Compresses chart to fit the panel width, no horizontal scroll |
| Wide | Adaptive density: the longest span fills ~25% of visible width; allows horizontal scrolling for long recordings |
Waterfall chart
The chart has two columns: Left label panel (frozen)- Span name
- Service name (color-coded)
- OpenTelemetry span kind icon
- Collapse / expand chevron for parent spans
- Horizontal bars representing span duration
- Time axis (in seconds) pinned to the bottom
- Bars colored by status
Span status colors
| Color | Status |
|---|---|
| Green | OK |
| Red | ERROR |
| Gray | Unset |
Span kind icons
Kinds follow OpenTelemetry conventions:INTERNAL, CLIENT, SERVER, PRODUCER, CONSUMER.
Filters
| Filter | Description |
|---|---|
| Text search | Filter by span name or service name |
| Kind | All · Internal · Client · Server · Producer · Consumer |
| Status | All · OK · Error · Unset |
Interacting with the chart
Navigate:- Vertical scroll browse rows
- Horizontal drag pan left/right within the chart area (click and drag on the background)
- Hover a bar tooltip shows span name, service, kind, duration, status
- Click a bar opens the span JSON modal
- Click a label scrolls the chart horizontally to bring that span’s bar into view
- Chevron collapse or expand a span’s children
- A vertical playhead line tracks the current video position
- The active span is highlighted in gold
- Parent and sibling spans in the call chain are also highlighted
- The chart auto-scrolls to keep the active span visible
- Seek button on each bar click to jump the video to that span’s start time
Span JSON modal
Click any span bar to open its detail modal:- Header: service name · span name, Copy JSON button
- Metadata row:
span_id,trace_id,parent_span_id,kind,status,duration - Data section: full key-value view of the span payload, including any custom data fields