

Activity types
Detail panels
Clicking an interval in the timeline opens a detail panel on the right. Each interval type has its own panel:Activity panel
Shows when you click an activity bar directly (without selecting a child):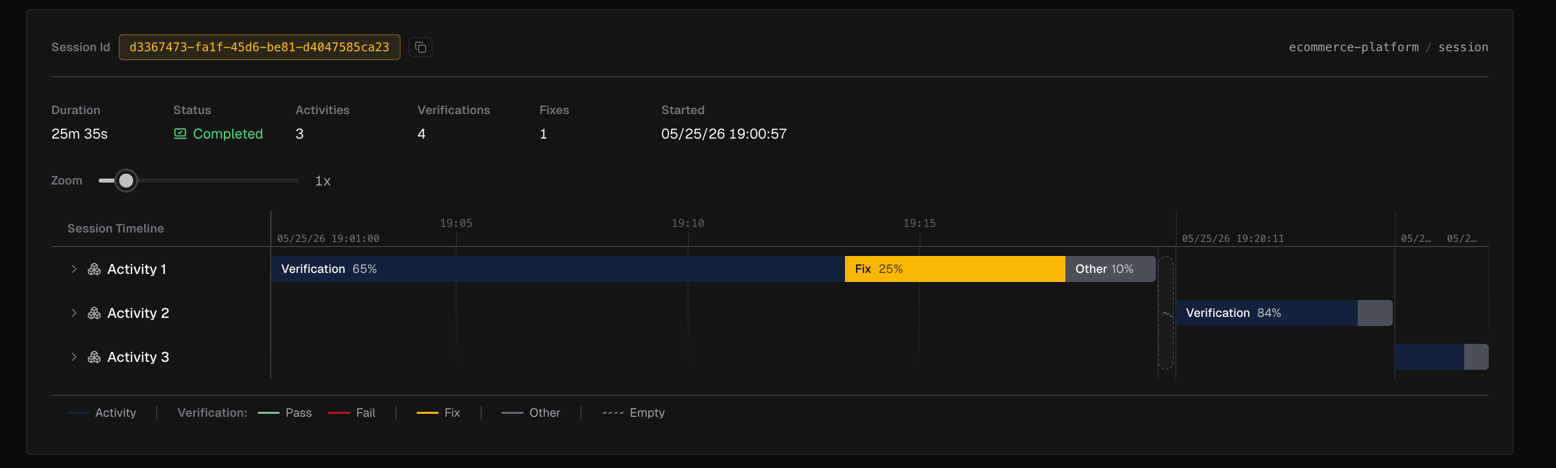
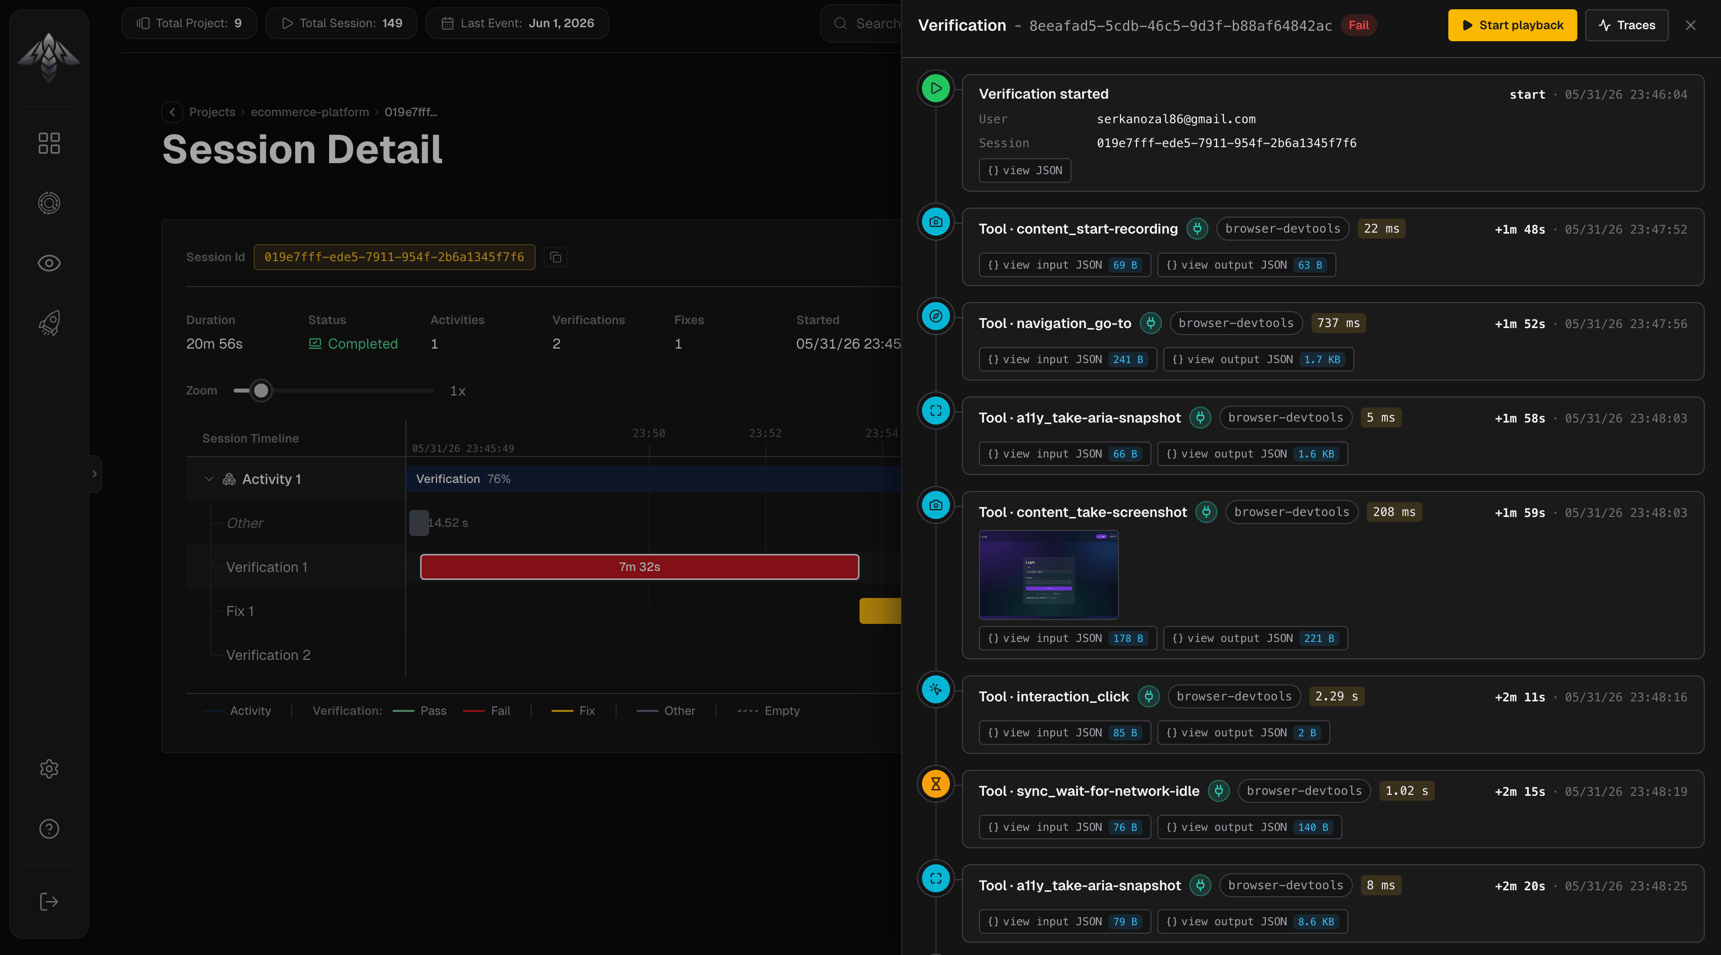
Verification panel
Shows when you click a verification interval:- Status badge: passed, failed, or abandoned
- Video playback: browser session recording if available (space/K to play, arrows to seek, J/L for ±10s)
- Event timeline: every tool call and assertion in order, with timestamps, input/output sizes, and expandable JSON details
- Image artifacts: screenshots shown inline with lightbox
Fix panel
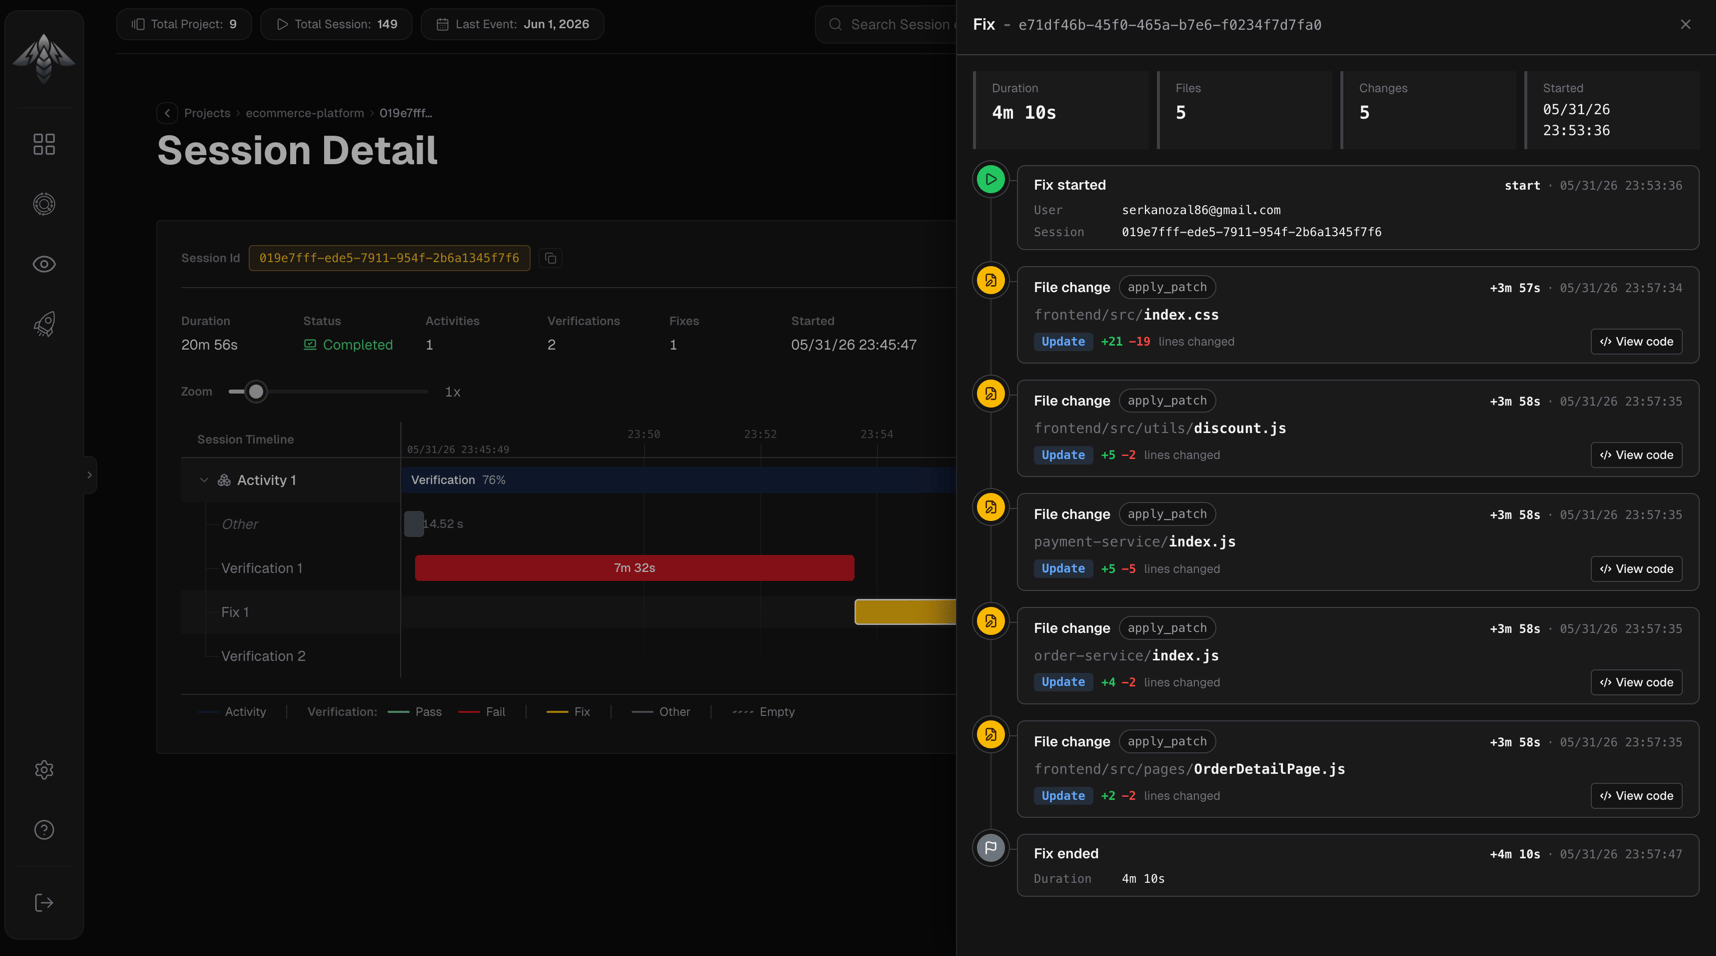
Shows when you click a fix interval:
Below the stats, a chronological event list shows each step of the fix:
- fix_start: user and session that initiated the fix
- file_change: file path, operation (create / update / delete), lines added/removed, tool that made the change, and a View code button that opens a diff dialog showing the full changeset
- fix_end: total duration and reason the fix concluded
Other panel
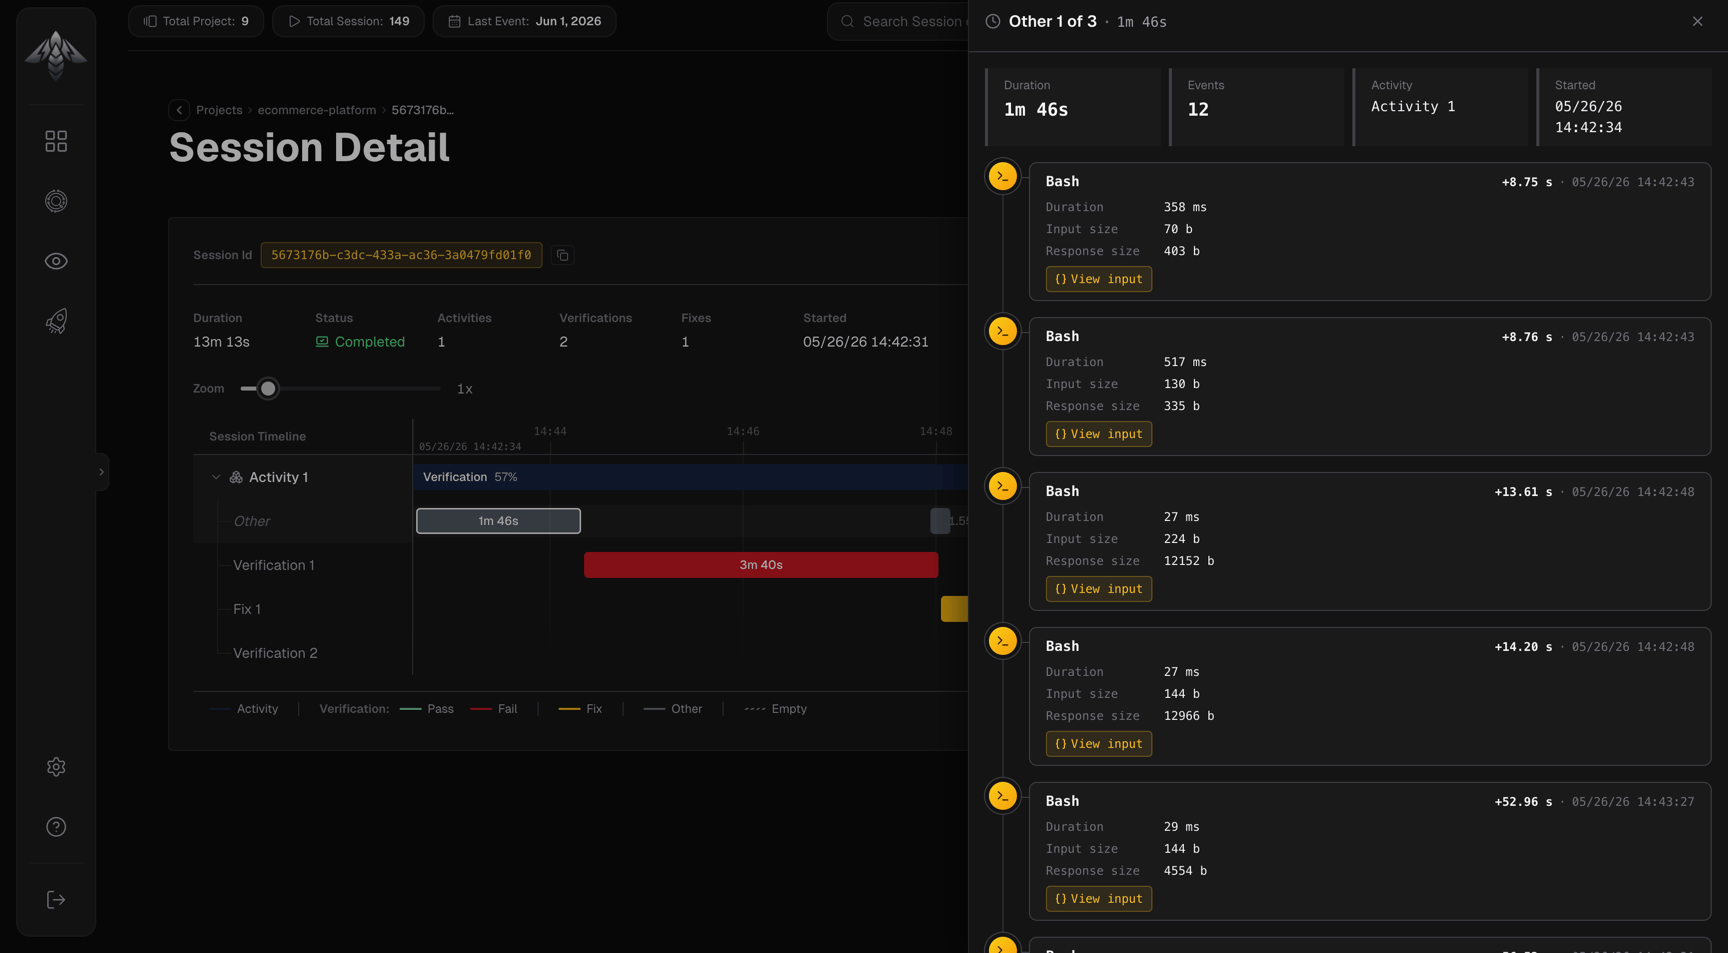
Shows when you click an “other” interval, for events that occurred outside a named verification or fix:
Each event in the list shows the tool name (with MCP server if applicable), relative and absolute timestamp, input size, response size, duration, and any error message. Click the input button to inspect the full tool input JSON.
Reading an activity
A healthy activity typically looks like:- Verification (passed) → task completes
- Verification (failed) → issues found
- Fix → agent corrects the code
- Verification (passed) → task completes