

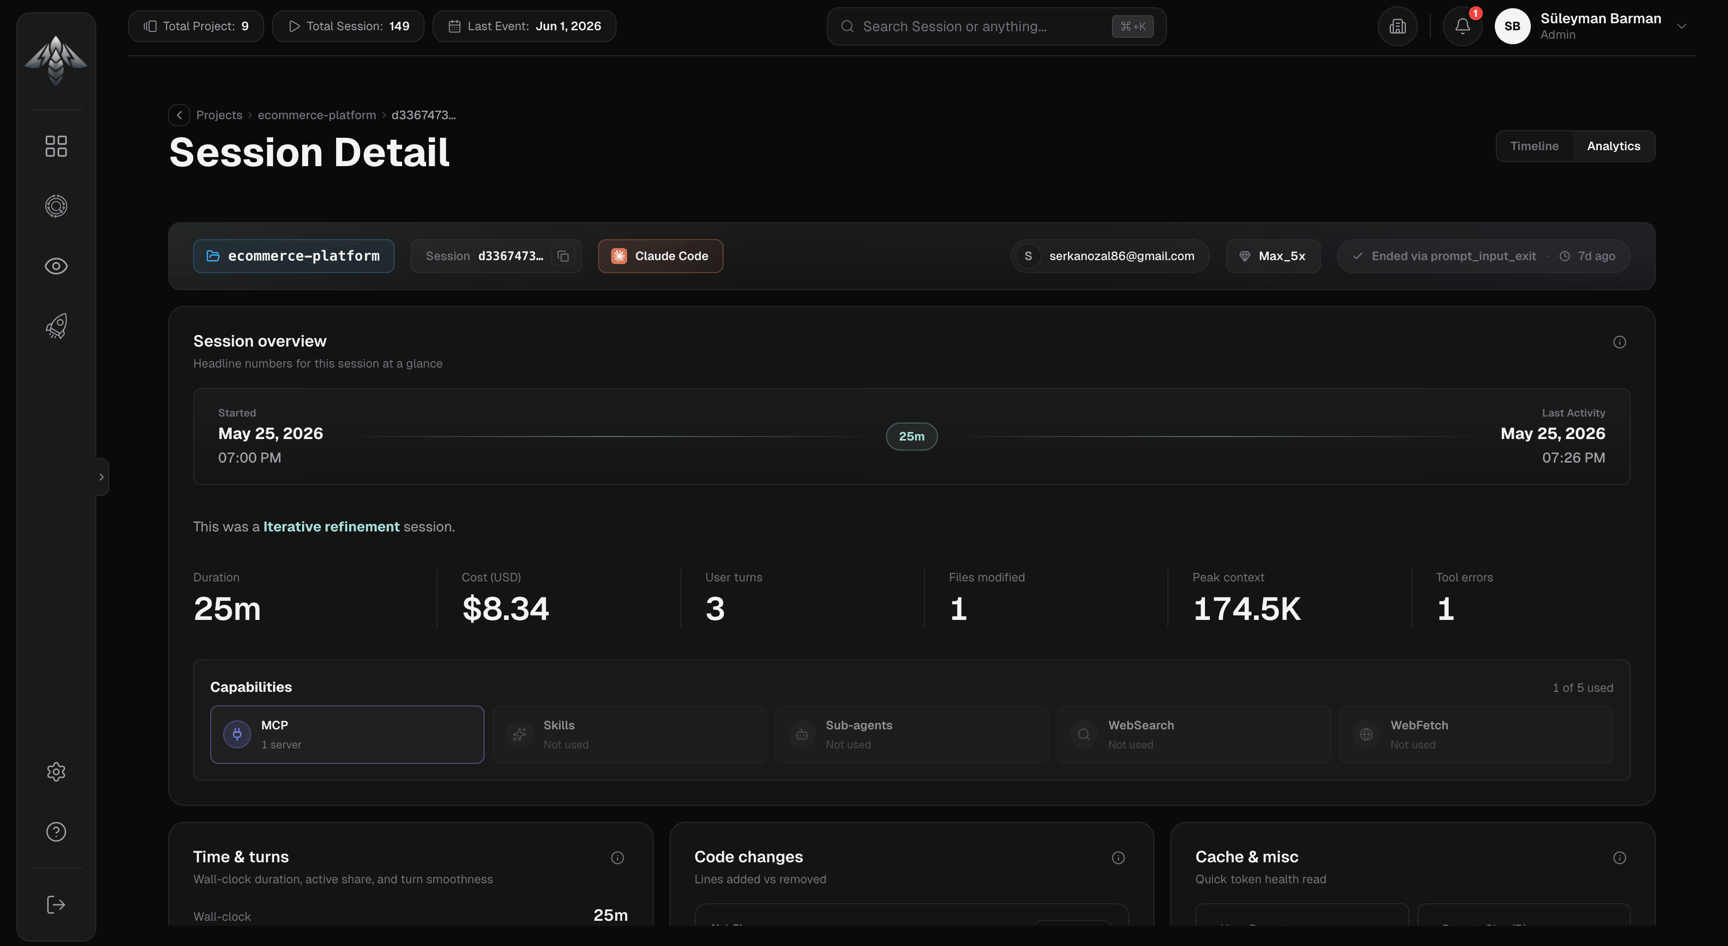
Session overview
Headline numbers for the session at a glance.- Hero stats: Duration, Cost (USD), User turns, Files modified, Peak context, Tool errors
- Session type: A characterization of the session: Quick question, Exploration, Iterative refinement, Multi-task, Focused single task, or Mixed
- Capabilities used: Chips for MCP, Skills, Sub-agents, WebSearch, WebFetch — filled if used at least once in the session
- Session window: Start and end timestamps with total duration in minutes
Time / Turns
Active vs idle duration split, plus user and assistant turn counts with a one-shot vs. with-retry breakdown.Code changes
Lines added, lines removed, files modified, and net line change for the session.Cache & misc
User prompt count, prompt size in bytes, approximate prompt tokens, and user interruption count.Context Window
Context occupancy over time. Two views:- Total area chart of total context tokens vs the model’s maximum context window
- Breakdown stacked chart of context by message type (Cache Read, Cache Write, Input, Output)
Cost / Tokens
Total cost in USD, input tokens, output tokens, cache create tokens, and cache read tokens.Models
Donut chart showing cost distribution across the models used in the session.Per-model tokens
Table with one row per model: message count, input tokens, output tokens, cache write, cache read, and cost. Sortable by any column, default sorted by cost descending.Context Pressure
Peak context tokens vs the model’s threshold, latest context tokens, a per-category breakdown (system prompt, user messages, tool results, etc.), and a progress bar relative to the full context window size.Session Shape
A horizontal stacked bar showing how the agent’s turns were distributed across activity categories: coding, debugging, refactoring, testing, documentation, and analysis.Tool usage
Four related tables:Other cards
Visible when the session has the relevant data:Context Breakdown Drawer
Opens from the Context Window card. A full-height side panel with four sections:Overview
Snapshot of the latest query: query number, model, query source, input tokens, input size in bytes, tool count.Context growth
Area chart showing token count by category across the full query sequence, traces how context filled up turn by turn. Visible when the session has more than one query.Breakdown
What occupies the context window in the latest query:- Composition tab has a treemap of 11 categories: system prompt, built-in tools, MCP tools, rules, memory, skills, system messages, user messages, assistant messages, tool results, others
- Detail tab has a drill-down tables showing token counts per MCP server, per rules file, per skill, and per tool result
Counts
- Tools: donut chart of built-in vs MCP tool count
- Messages: pie chart of user, assistant, tool result, and system message counts