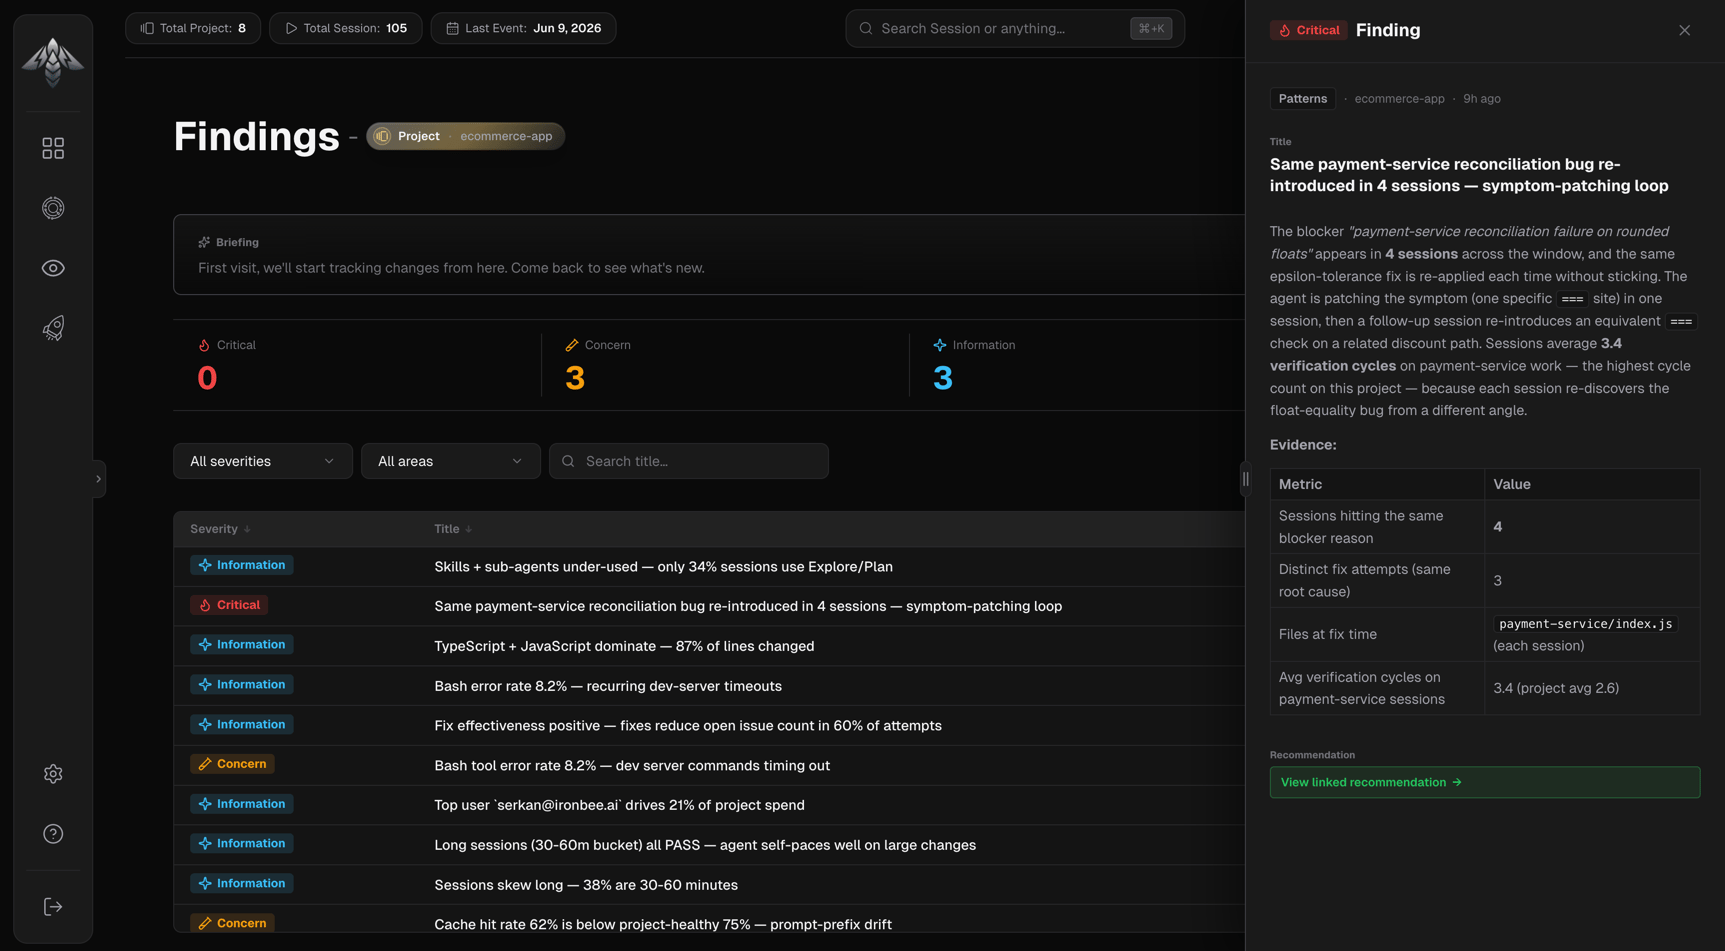
Findings are observations that IronBee’s analysis identified patterns and problems grounded in actual session data. Project-level findings are produced by the Project Quality, Project Cost, and Project Session Insights analysis runs and reflect what’s happening in a specific codebase. IronBee Console — Project Findings Select a project from the project picker to view its findings.

Finding areas

AreaWhat it covers
QualityVerification thoroughness, fix effectiveness, recurring failures
EfficiencyTime and compute waste, rework rate, slow sessions
PatternsFiles and issues that recur across sessions
BehaviorAgent working habits and interaction style
CostToken spend, cache efficiency, expensive sessions

Severity levels

SeverityMeaning
notice (Information)Descriptive observation, informational, no action required
concernWorth watching, may have a linked recommendation
criticalSerious degradation, should have a linked recommendation
Only concern and critical findings can have recommendations attached.

KPI strip

Four tiles show counts pulled directly from the project’s stats:
TileDescription
CriticalCount of critical findings for this project
ConcernCount of concern findings
InformationCount of notice findings
Total findingsSum of all active findings

Briefing panel

Reports changes since your last visit to this project’s findings:
  • First visit: starts tracking from this point
  • No changes: nothing new since your last visit (shows timestamp)
  • Changes detected: new and resolved findings summarized in severity-colored text
Dismiss with the × button. Can be toggled in Settings.

Filters

FilterOptions
SeverityAll severities · Critical · Concern · Information
AreaAll areas · Quality · Efficiency · Patterns · Behavior · Cost
Title searchFree text (min 3 characters)
Active filters appear as chips. Clear filters removes severity, area, and title — pinned filters (Finding ID, Analysis ID) are cleared individually.

Findings table

Four columns, all sortable (no Project column, scope is already fixed to the selected project):
ColumnDescription
SeverityBadge with icon, Critical (flame), Concern (test tube), Information (sparkle)
TitleBrief description of the observation
AreaQuality · Efficiency · Patterns · Behavior · Cost
CreatedHow long ago the finding was generated
Default sort: Created, newest first. Page sizes: 20, 50, or 100 rows.

Finding detail drawer

Click any row to open the detail drawer:
  • Severity badge and area, project, and created date in the header
  • Title: the finding headline
  • Body: full markdown description with supporting evidence, metrics, and inline visualizations where applicable
  • View linked recommendation button shown for critical and concern findings; navigates to the Recommendations page filtered to this finding