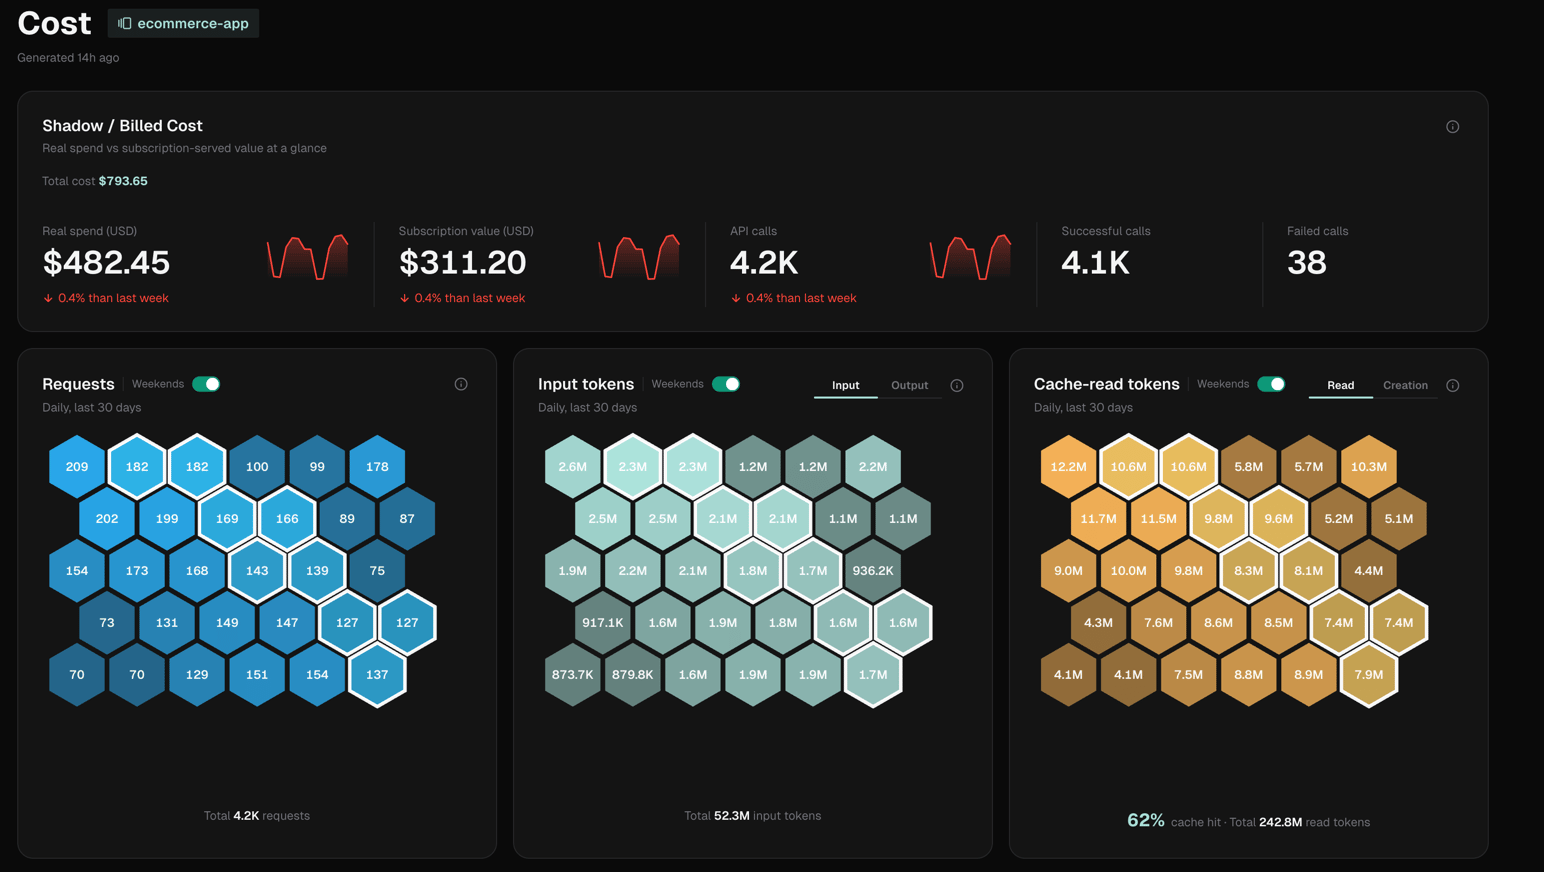
The Project Cost analysis breaks down API spend for a single project: real (billed) cost vs subscription-served (shadow) value, token usage patterns, and which sessions drove the most cost. IronBee Console — Project Cost Analysis

Shadow / Billed cost

The hero card shows five metrics with sparklines and week-over-week deltas:
MetricDescription
Real spendUSD billed by the API for this project
Subscription valueUSD equivalent served from subscription credits
API callsTotal requests made
Successful callsRequests that returned a response
Failed callsRequests that errored or timed out

Daily activity honeycombs

Three 30-day honeycomb grids (cell intensity = value). Each has a weekends toggle:
  • Requests: daily request count
  • Input / Output tokens: toggle between input and output token counts
  • Cache-read / Cache-creation tokens: toggle between read and creation; footer shows cache hit %

Cost summary

Four aggregate stats: API calls, average real spend per session, average subscription value per session, and cache-read token total.

Daily cost chart

Two-way bar chart showing billed cost (up) vs shadow value (down) per day. Makes it easy to see the ratio of API spend to subscription benefit over time.

Cost over time

Stacked area chart of daily billed + shadow cost across the analysis window.

Cost per session

Grouped bar chart showing average, p50, p90, and p99 cost per session, both billed and shadow. Useful for spotting outlier sessions that are pulling the average up.

By model

Stacked bar chart broken down by model. Metric toggle: Cost, Tokens, Cache, Requests, Cache hit %.

Top billed sessions / Top shadow sessions

Two ranked lists of up to 10 sessions each: the sessions with the highest real spend and the highest shadow value respectively.

Tool metrics

Table of tools with call count, error count, error rate, and speed metrics. Useful for identifying expensive or slow tool patterns driving cost.