

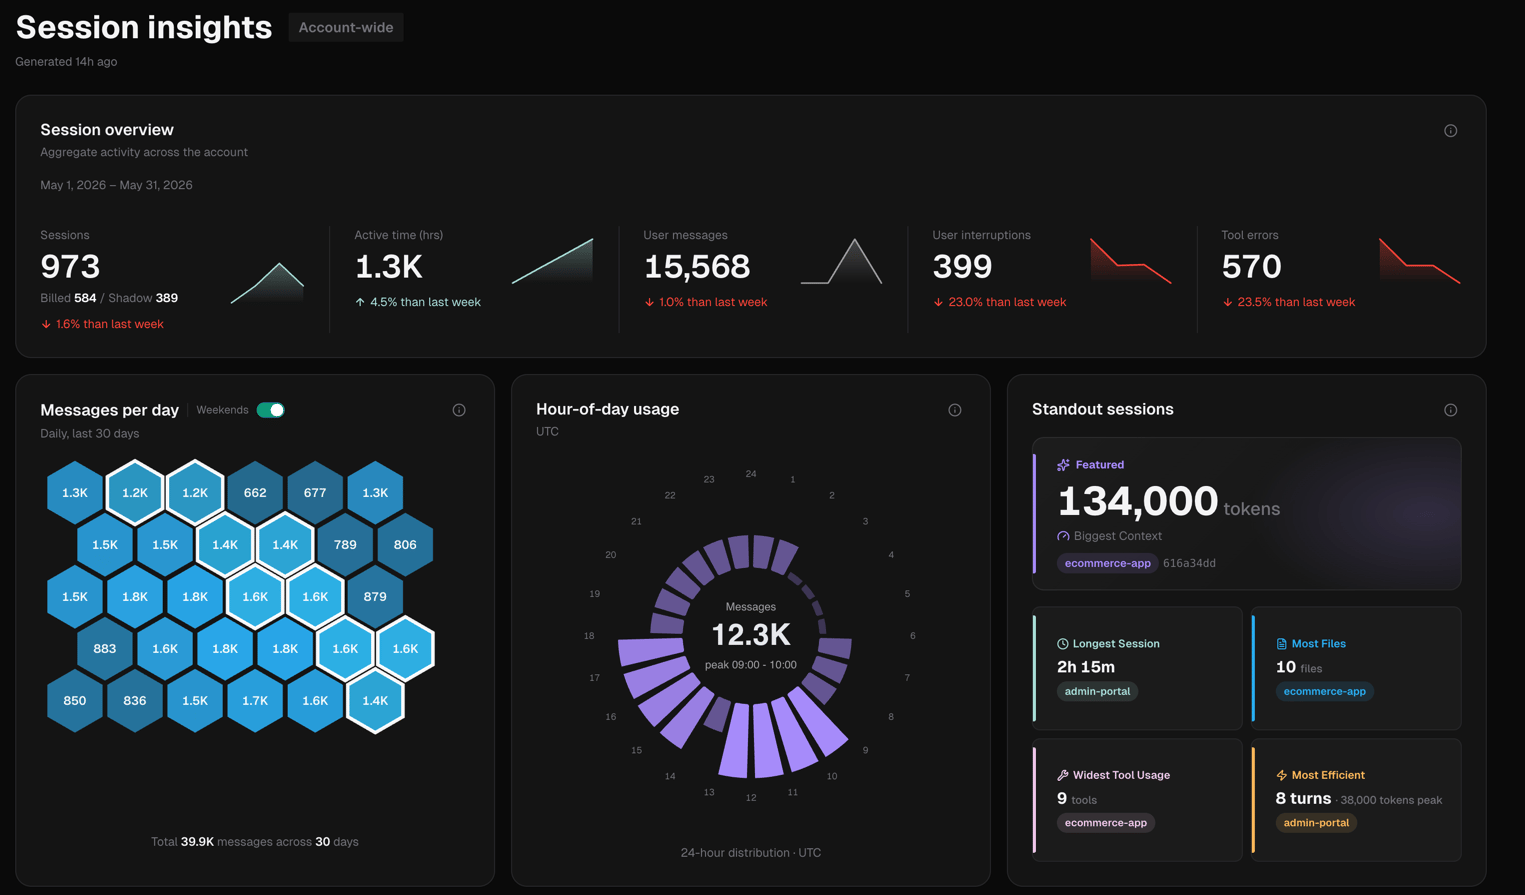
Session overview
Hero card with five metrics (sparklines + week-over-week deltas):Activity heartbeat
- Messages per day: 30-day honeycomb grid with weekends toggle
- Hour-of-day usage: polar bar chart (UTC)
- Standout sessions: longest, highest context peak, most files, widest tool usage, most efficient, with project attribution
Time & code activity
Wall-clock vs active vs idle split, concurrency events (overlapping sessions), and code change breakdown (lines added/removed).By project
Table of all projects: session count, total duration, files changed, tool errors. Sortable by any column, default sorted by sessions descending.Response time
Bar histogram across buckets:<1s, 1–2s, 2–10s, 10–30s, 30s–1m, 1–2m, 2–5m, 5–15m, >15m.
Context pressure
Line chart of average peak context by turn bucket with summary stats (avg peak, max, avg at session end, high-pressure session count).Models
Donut chart of session distribution across Claude models, account-wide.Languages
Radar chart of lines changed across the top 8 programming languages, account-wide.Adoption signals
Feature adoption indicators across the account: MCP servers, sub-agents, skills, web search, web fetch.Hot files
Top files by edit frequency across all projects, with list or treemap view.Session types
Sankey diagram from session type to activity category.Activity categories
Horizontal bar chart of turns by activity category.Tool error categories
Horizontal bar chart of errors by category.Tool leaderboards
- Top tools: calls, errors, error %, sessions
- MCP servers / Shell binaries: toggled view
- Skills: custom command usage
- Sub-agents: background agent usage