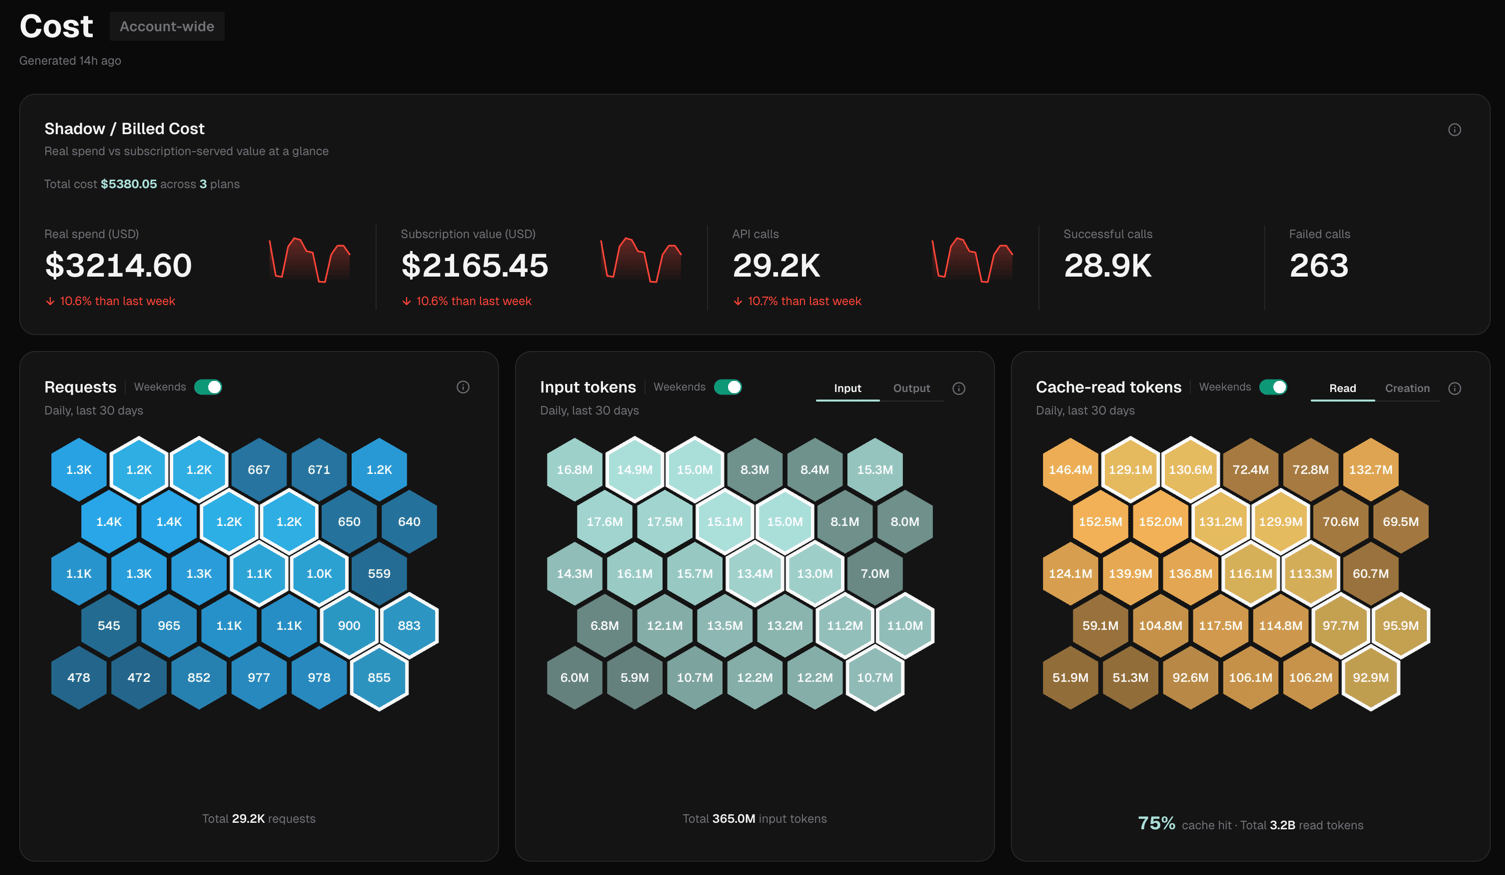
The Account Cost analysis aggregates API spend across every project and user on the account. It has the same structure as Project Cost Analysis with additional breakdowns for cross-project and cross-user comparisons. IronBee Console — Account Cost Analysis

Shadow / Billed cost

Hero card with five metrics (sparklines + week-over-week deltas):
MetricDescription
Real spendTotal USD billed across the account
Subscription valueTotal USD equivalent served from subscription credits
API callsTotal requests across all projects
Successful callsRequests that returned a response
Failed callsRequests that errored or timed out
The total cost line also shows the number of active projects contributing to the figure.

Daily activity honeycombs

Three 30-day honeycomb grids with weekends toggle:
  • Requests: daily request count
  • Input / Output tokens: toggle between input and output
  • Cache-read / Cache-creation tokens: toggle between read and creation; footer shows cache hit %

Cost summary

API calls, average real spend per session, average subscription value per session, and active projects count.

Daily cost chart

Two-way bar chart: billed up, shadow down, per day across the account.

Cost over time

Stacked area chart of daily billed + shadow cost.

Cost per session

Grouped bar chart: avg, p50, p90, p99, billed vs shadow.

By model

Stacked bar chart by model with metric toggle: Cost, Tokens, Cache, Requests, Cache hit %.

By plan

Stacked bar chart by subscription plan with the same metric toggle. Shows cost distribution across Claude plans used across the account.

By project

Table of all projects: request count, input tokens, output tokens, cache read, cache create, cache %, billed cost, shadow value, total cost. Sortable by any column.

Top cost by user

Table of all users: request count, input/output/cache tokens, billed cost, shadow value, total cost. Sortable by any column.

Top billed sessions / Top shadow sessions

Two ranked lists of up to 10 sessions each: the highest-cost sessions across the entire account, with project attribution.

Tool metrics

Table of tools with call count, error rate, and speed, aggregated across all projects.