

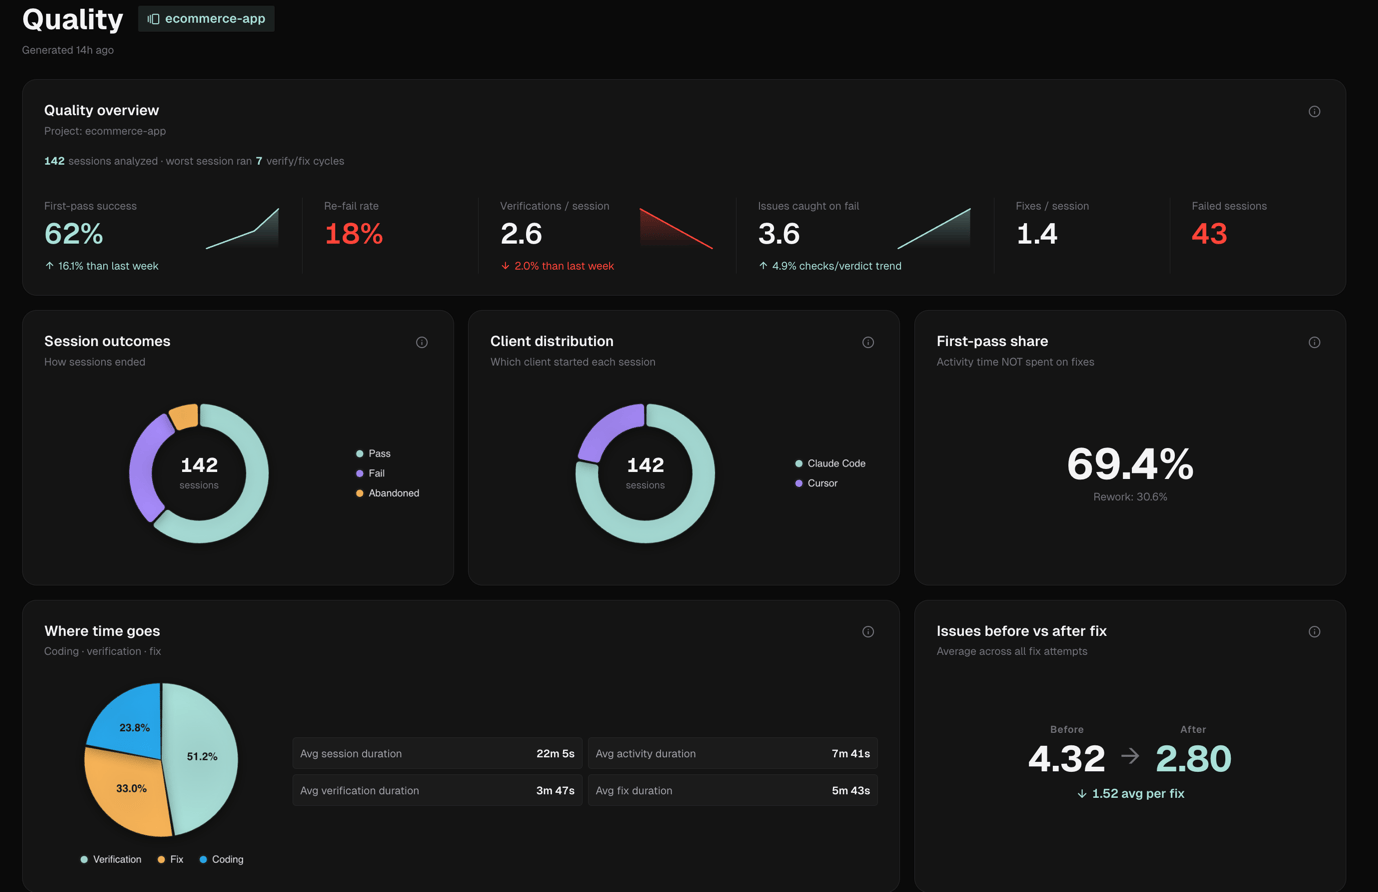
Quality overview
The hero card shows six metrics, each with an 8-week sparkline and a week-over-week delta:Session outcomes
Three cards break down how sessions ended:- Session outcomes: donut chart of Pass, Fail, Abandoned, and Completed sessions
- Client distribution: donut chart showing which AI client (Claude Code, Cursor) ran each session
- First-pass share: efficiency % (time NOT spent on fixes) vs rework %
Where time goes
Time distribution across Coding, Verification, and Fix phases, shown as a pie chart alongside four averages: session duration, activity duration, verification duration, fix duration.Issues before vs after fix
Average issue count before a fix attempt vs after, with a delta indicator. Shows whether fixes are actually resolving the problems the agent finds.Verification depth
Grouped bar chart comparing how thoroughly the agent checked before passing vs before failing:- Checks per verdict
- Screenshots per verification
- Aria snapshots per verification
- Issues per failed verdict
Fix outcomes
Donut chart categorizing fix cycles as:- Helpful: the fix reduced or resolved the issues
- No-effect: issues unchanged after the fix
- Backfiring: the fix introduced new issues
Top blockers
The most frequent reasons the agent was blocked, the recurring patterns across failed verifications. Up to 10 entries.Hot files
Files under the most verification pressure, highest frequency of triggering a cycle or appearing in failed verdicts. Up to 10 files.Weekly trend
Line chart of the selected metric over the last 30 days by ISO week. Toggle between: Pass rate, Efficiency, Cycles, Checks.Outcomes by session size
Heatmap of session outcomes plotted by duration (rows) vs activity count (columns) shows whether longer or more complex sessions tend to fail more.Recent corpus
Three text lists drawn from recent session verdicts:- Recent issues: text the agent flagged during failed verifications
- Recent fixes: what the agent said it did to resolve problems
- Recent verification checks: assertions the agent verified against