> ## Documentation Index
> Fetch the complete documentation index at: https://docs.ironbee.ai/llms.txt
> Use this file to discover all available pages before exploring further.
# Verification Detail
> Event timeline, video playback, verdict, and traces for a single verification cycle.
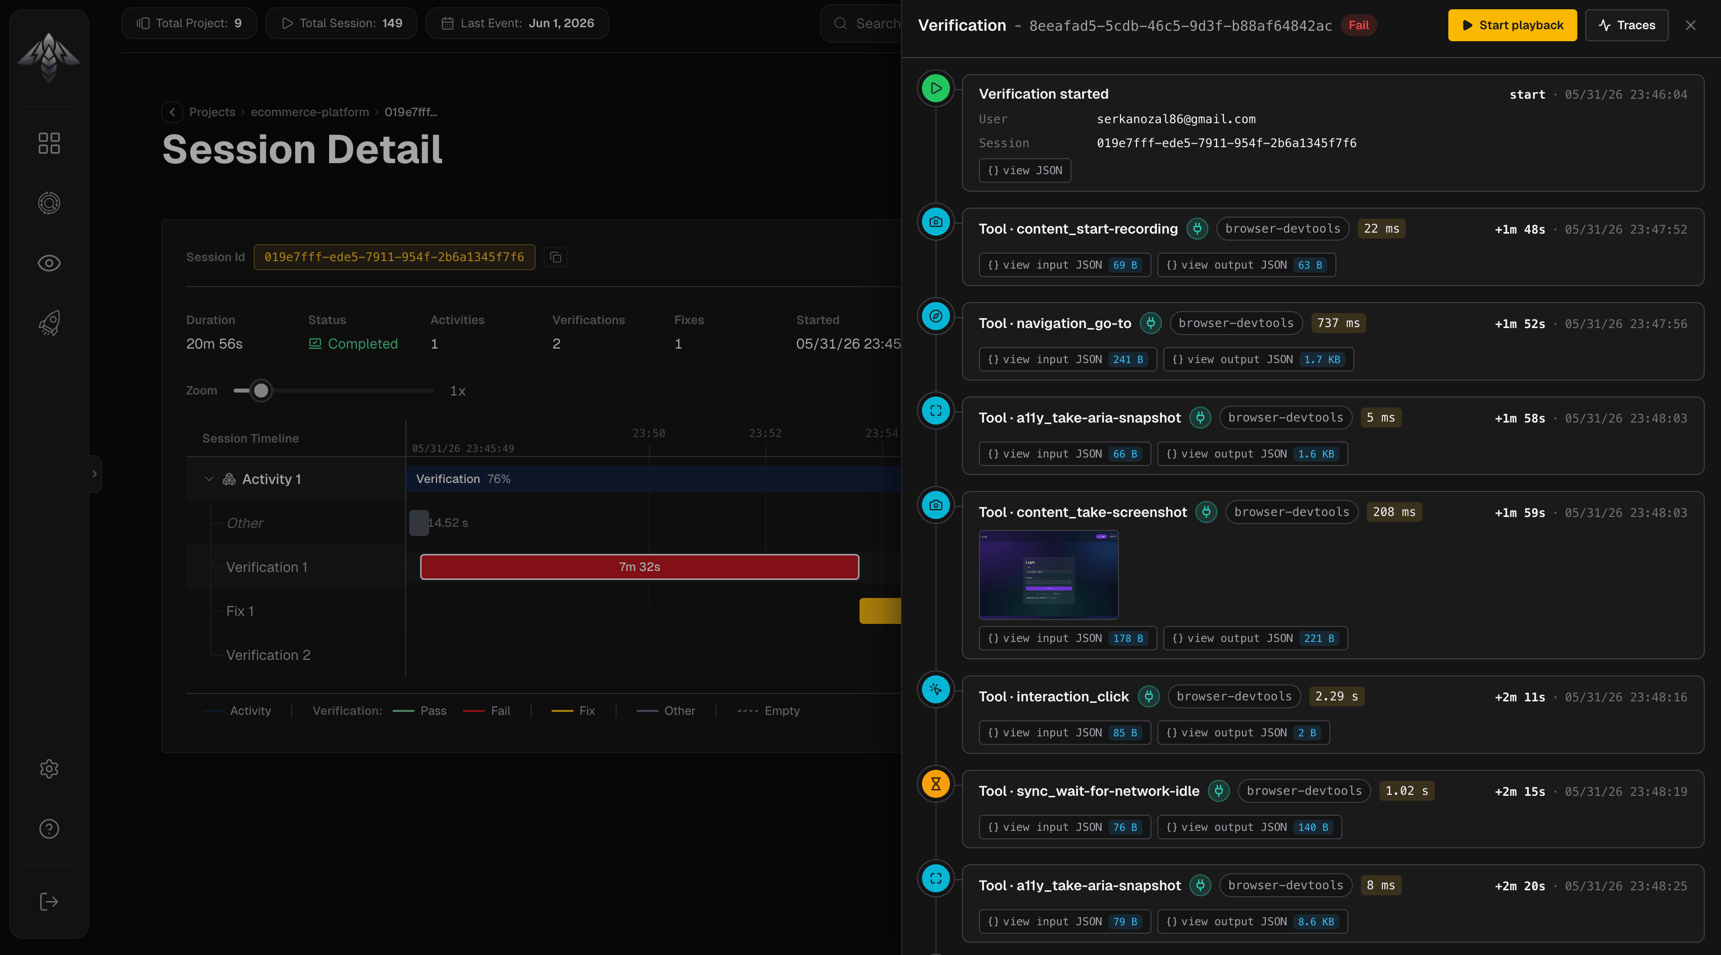
The verification detail panel opens when you click a verification interval in the [Session Timeline](/console/session-timeline). It shows everything that happened during the cycle: the event sequence, video recording, verdict, and traces.
 ## Header
The panel header shows the verification ID and a status chip: **Pass**, **Fail**, **In progress**, or **Unknown**. Two buttons sit alongside it:
* **Traces** toggles the [trace panel](#trace-panel)
* **Play** arms video playback (visible when a recording exists)
***
## Video playback
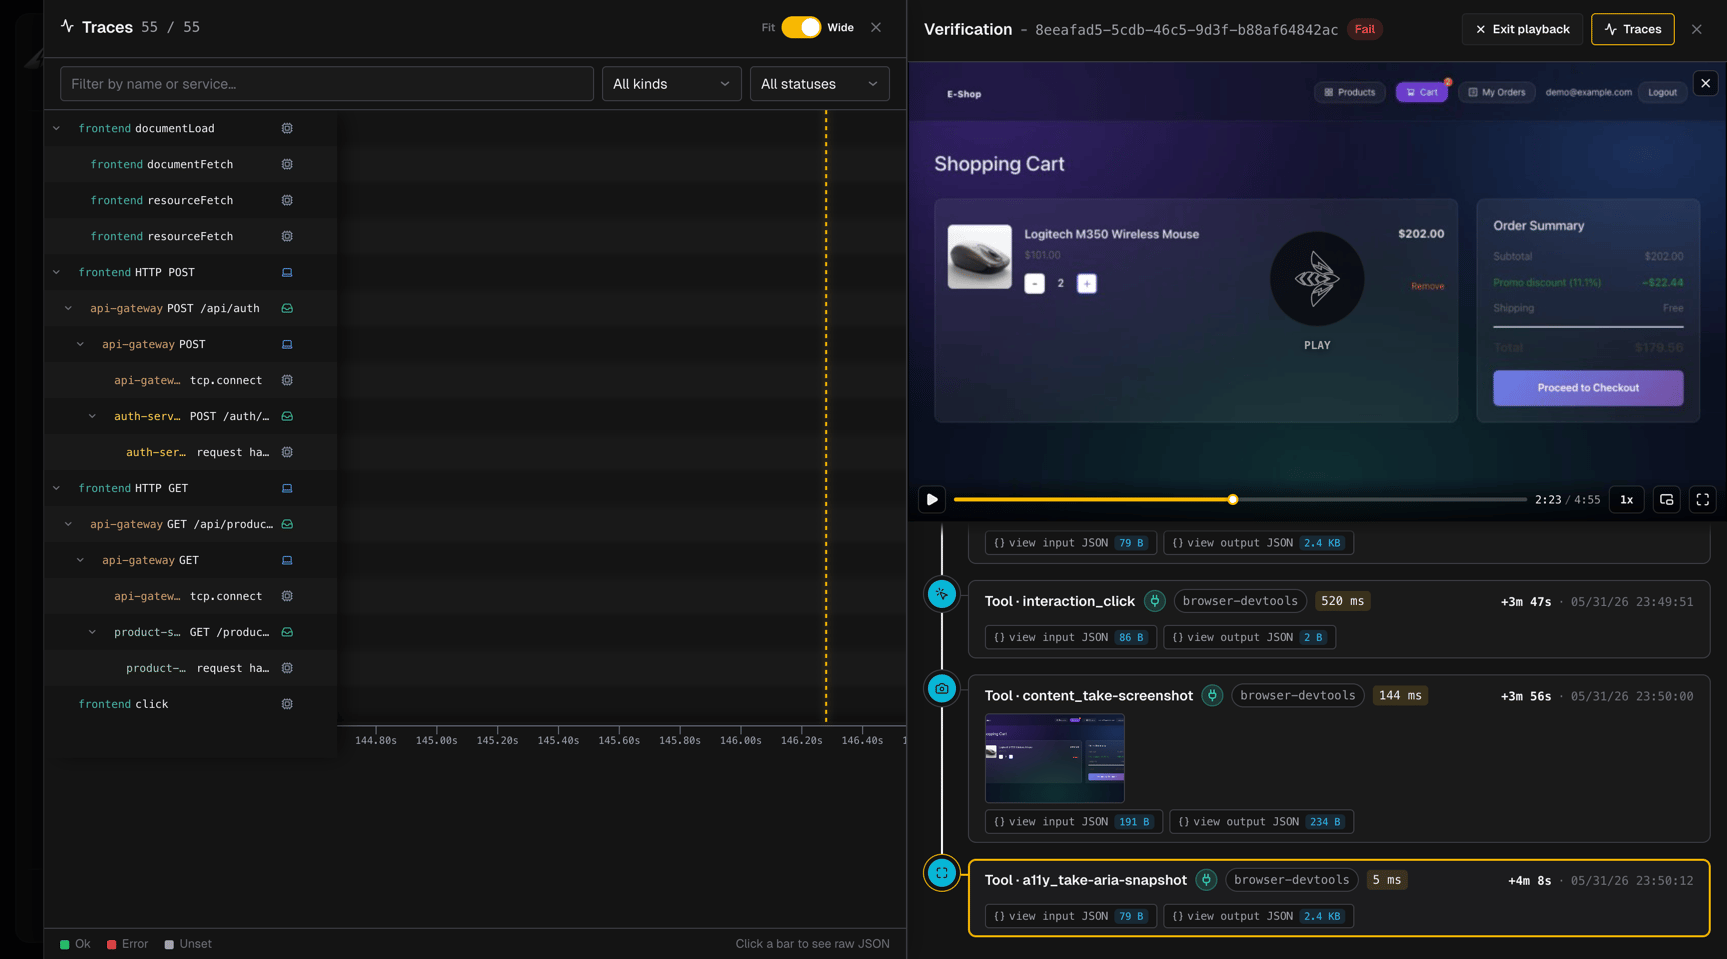
When a browser session recording is available, the playback section shows a video player with:
* Play / pause button
* Scrub track with drag support
* Current time and total duration
* Speed toggle — 1× and 2×
* Picture-in-Picture button
* Fullscreen button
## Header
The panel header shows the verification ID and a status chip: **Pass**, **Fail**, **In progress**, or **Unknown**. Two buttons sit alongside it:
* **Traces** toggles the [trace panel](#trace-panel)
* **Play** arms video playback (visible when a recording exists)
***
## Video playback
When a browser session recording is available, the playback section shows a video player with:
* Play / pause button
* Scrub track with drag support
* Current time and total duration
* Speed toggle — 1× and 2×
* Picture-in-Picture button
* Fullscreen button
 **Keyboard shortcuts:**
| Key | Action |
| ------------- | ---------------- |
| `Space` / `k` | Play / pause |
| `←` / `→` | Seek ±1 second |
| `j` / `l` | Seek ±10 seconds |
While playing, the event timeline below highlights the event corresponding to the current video time.
***
## Event timeline
A chronological list of every event recorded during the verification cycle. Each row is clickable to expand its details.
### Event types
| Event | What it shows |
| ------------------------ | ------------------------------------------------------------------------------------------------------------------------------------------------------------- |
| **Verification started** | User email and session ID |
| **Tool call** | Tool name, MCP server (if applicable), type badge (mcp / skill / sub-agent), duration, input size, response size, any error, inline images or videos captured |
| **Verification ended** | Status, duration, and reason |
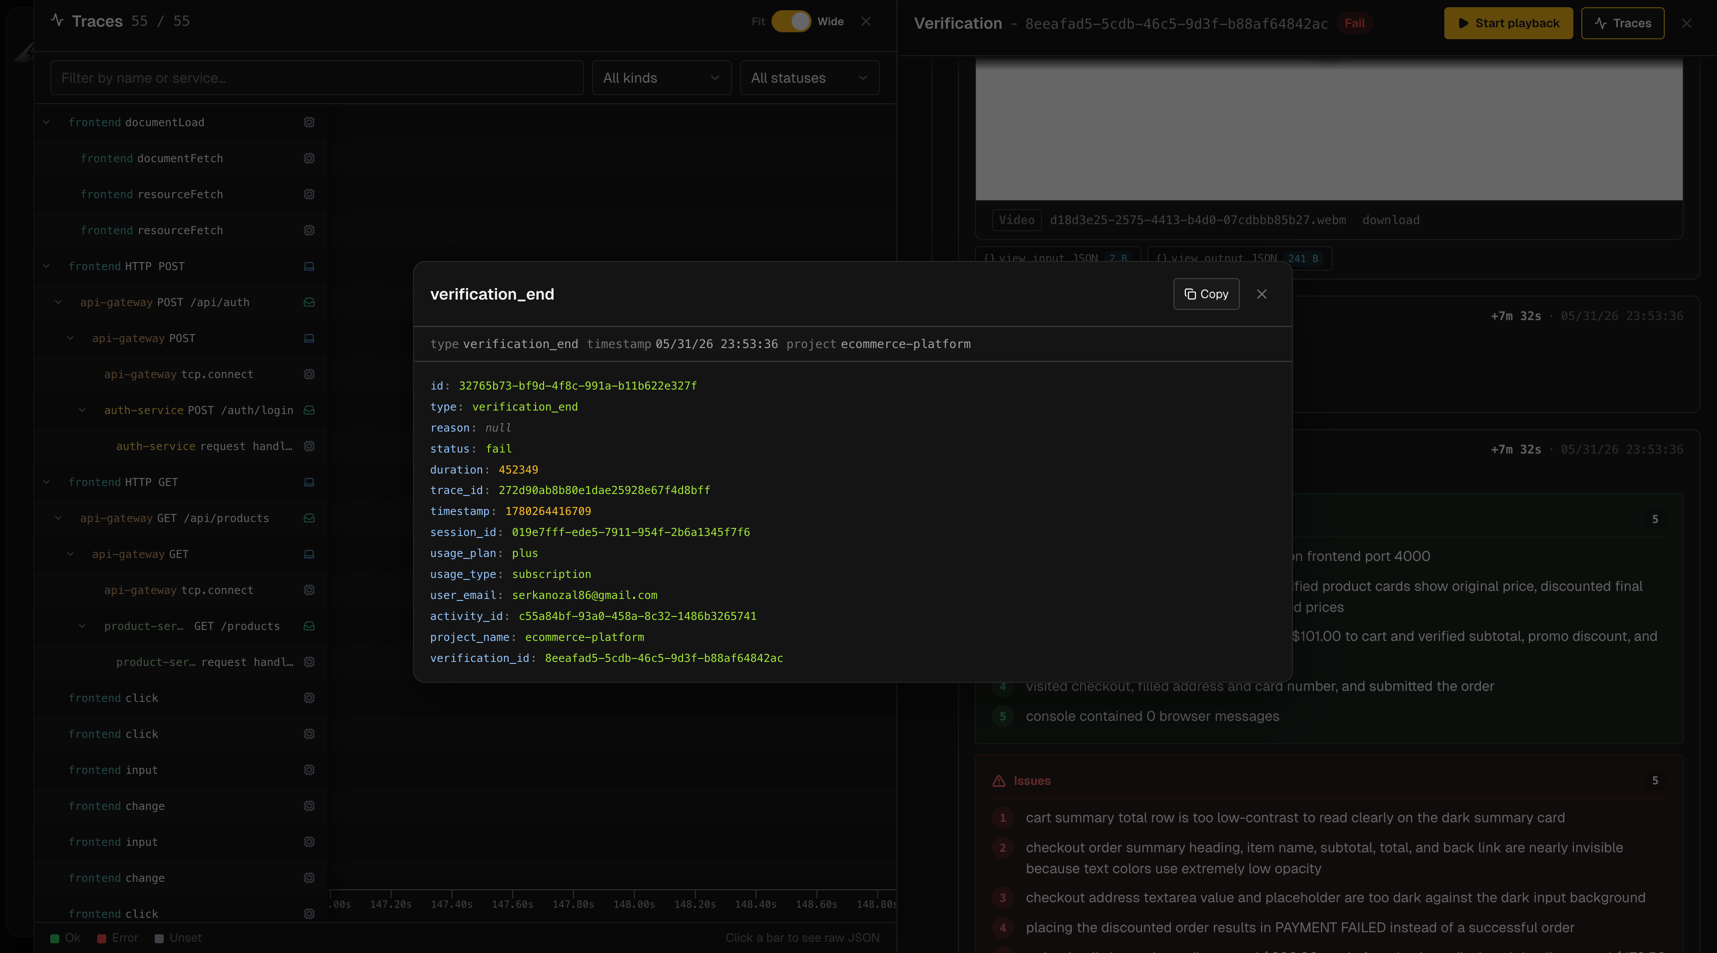
| **Verdict** | Final pass or fail, with the full **Checks**, **Issues**, and **Fixes** lists |
### Per-event details
Each row shows:
* A color-coded icon by tool domain (file, search, exec, web, UI, diagnostic, flow)
* Time offset from the start of the cycle (e.g., `+1m 23s`)
* Absolute timestamp
* Status chips. error indicator, duration, MCP server name, tool type badge
* **View JSON** button tool events split into Input / Output with byte sizes; other events show a full view
**Keyboard shortcuts:**
| Key | Action |
| ------------- | ---------------- |
| `Space` / `k` | Play / pause |
| `←` / `→` | Seek ±1 second |
| `j` / `l` | Seek ±10 seconds |
While playing, the event timeline below highlights the event corresponding to the current video time.
***
## Event timeline
A chronological list of every event recorded during the verification cycle. Each row is clickable to expand its details.
### Event types
| Event | What it shows |
| ------------------------ | ------------------------------------------------------------------------------------------------------------------------------------------------------------- |
| **Verification started** | User email and session ID |
| **Tool call** | Tool name, MCP server (if applicable), type badge (mcp / skill / sub-agent), duration, input size, response size, any error, inline images or videos captured |
| **Verification ended** | Status, duration, and reason |
| **Verdict** | Final pass or fail, with the full **Checks**, **Issues**, and **Fixes** lists |
### Per-event details
Each row shows:
* A color-coded icon by tool domain (file, search, exec, web, UI, diagnostic, flow)
* Time offset from the start of the cycle (e.g., `+1m 23s`)
* Absolute timestamp
* Status chips. error indicator, duration, MCP server name, tool type badge
* **View JSON** button tool events split into Input / Output with byte sizes; other events show a full view
 Images captured by tool calls appear inline within the event row. Click an image to open it in a lightbox.
***
## Verdict
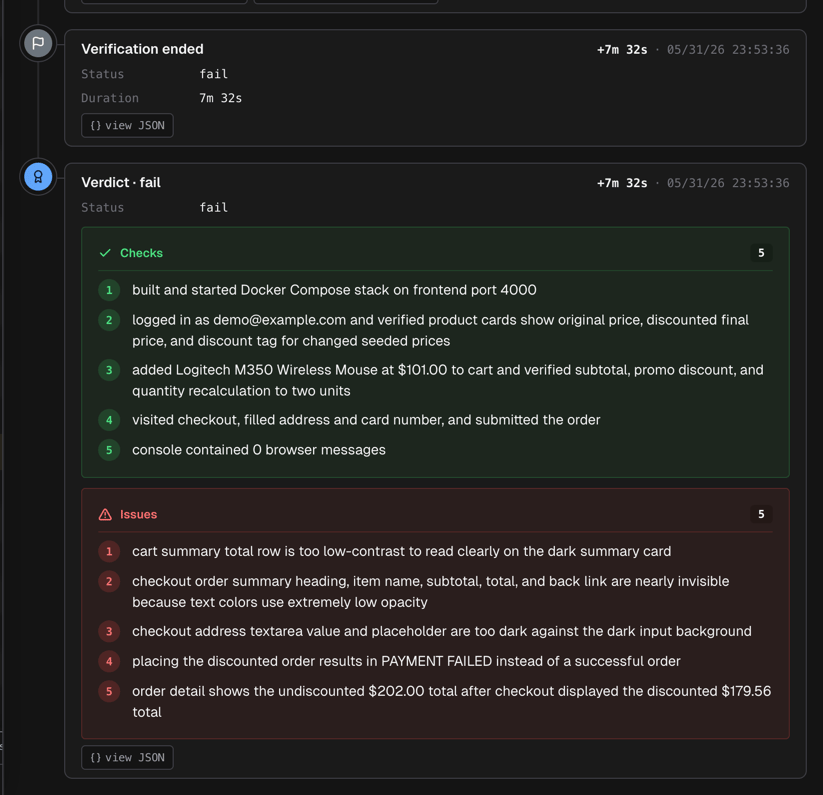
The verdict section at the bottom of the event timeline shows the final assessment:
* **Status:** `pass` or `fail`
* **Checks:** evidence items the agent confirmed (green)
* **Issues:** what went wrong, if the verdict is `fail` (red)
* **Fixes:** what was changed to resolve issues on a passing retry (orange)
Images captured by tool calls appear inline within the event row. Click an image to open it in a lightbox.
***
## Verdict
The verdict section at the bottom of the event timeline shows the final assessment:
* **Status:** `pass` or `fail`
* **Checks:** evidence items the agent confirmed (green)
* **Issues:** what went wrong, if the verdict is `fail` (red)
* **Fixes:** what was changed to resolve issues on a passing retry (orange)
 ***
## Trace panel
Click **Traces** in the header to open the trace panel alongside the event timeline. The panel shows a span waterfall chart for the cycle with:
* **Filters:** by span kind (Internal / Client / Server / Producer / Consumer) and status (OK / Error / Unset)
* **Text search:** filter spans by name or service name
* **View toggle;** Fit (panel-width) or Wide (horizontal scroll for dense traces)
***
## Trace panel
Click **Traces** in the header to open the trace panel alongside the event timeline. The panel shows a span waterfall chart for the cycle with:
* **Filters:** by span kind (Internal / Client / Server / Producer / Consumer) and status (OK / Error / Unset)
* **Text search:** filter spans by name or service name
* **View toggle;** Fit (panel-width) or Wide (horizontal scroll for dense traces)
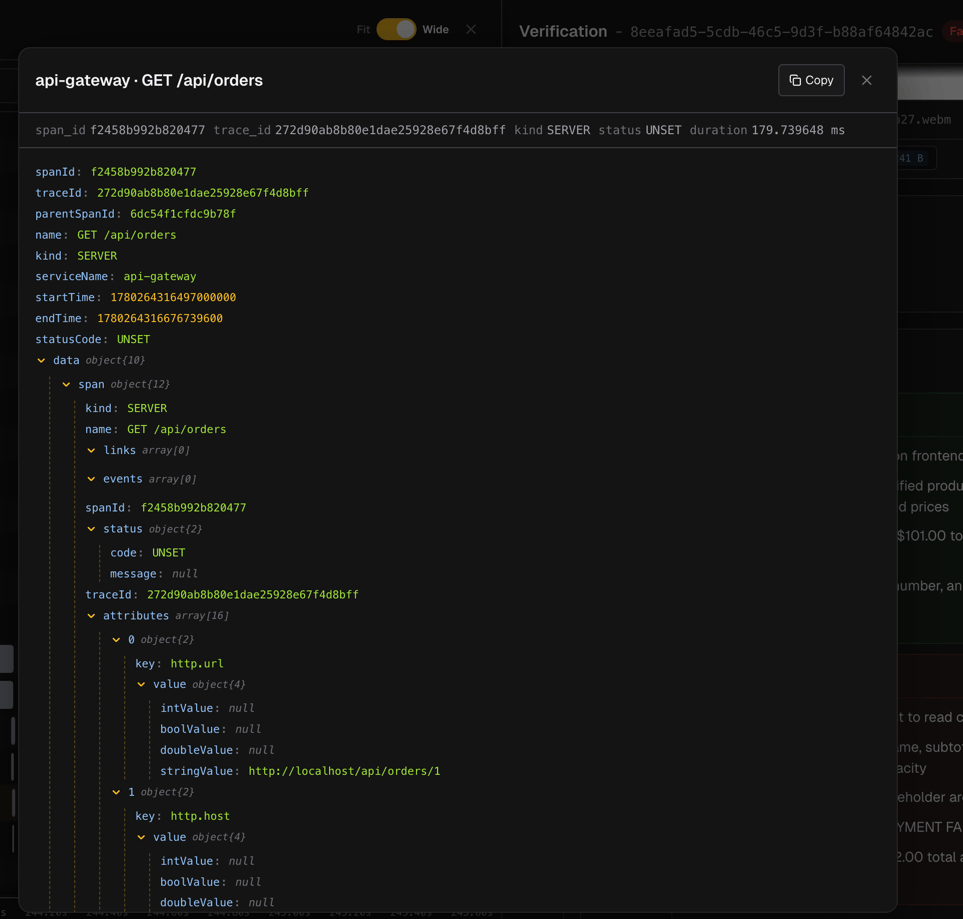
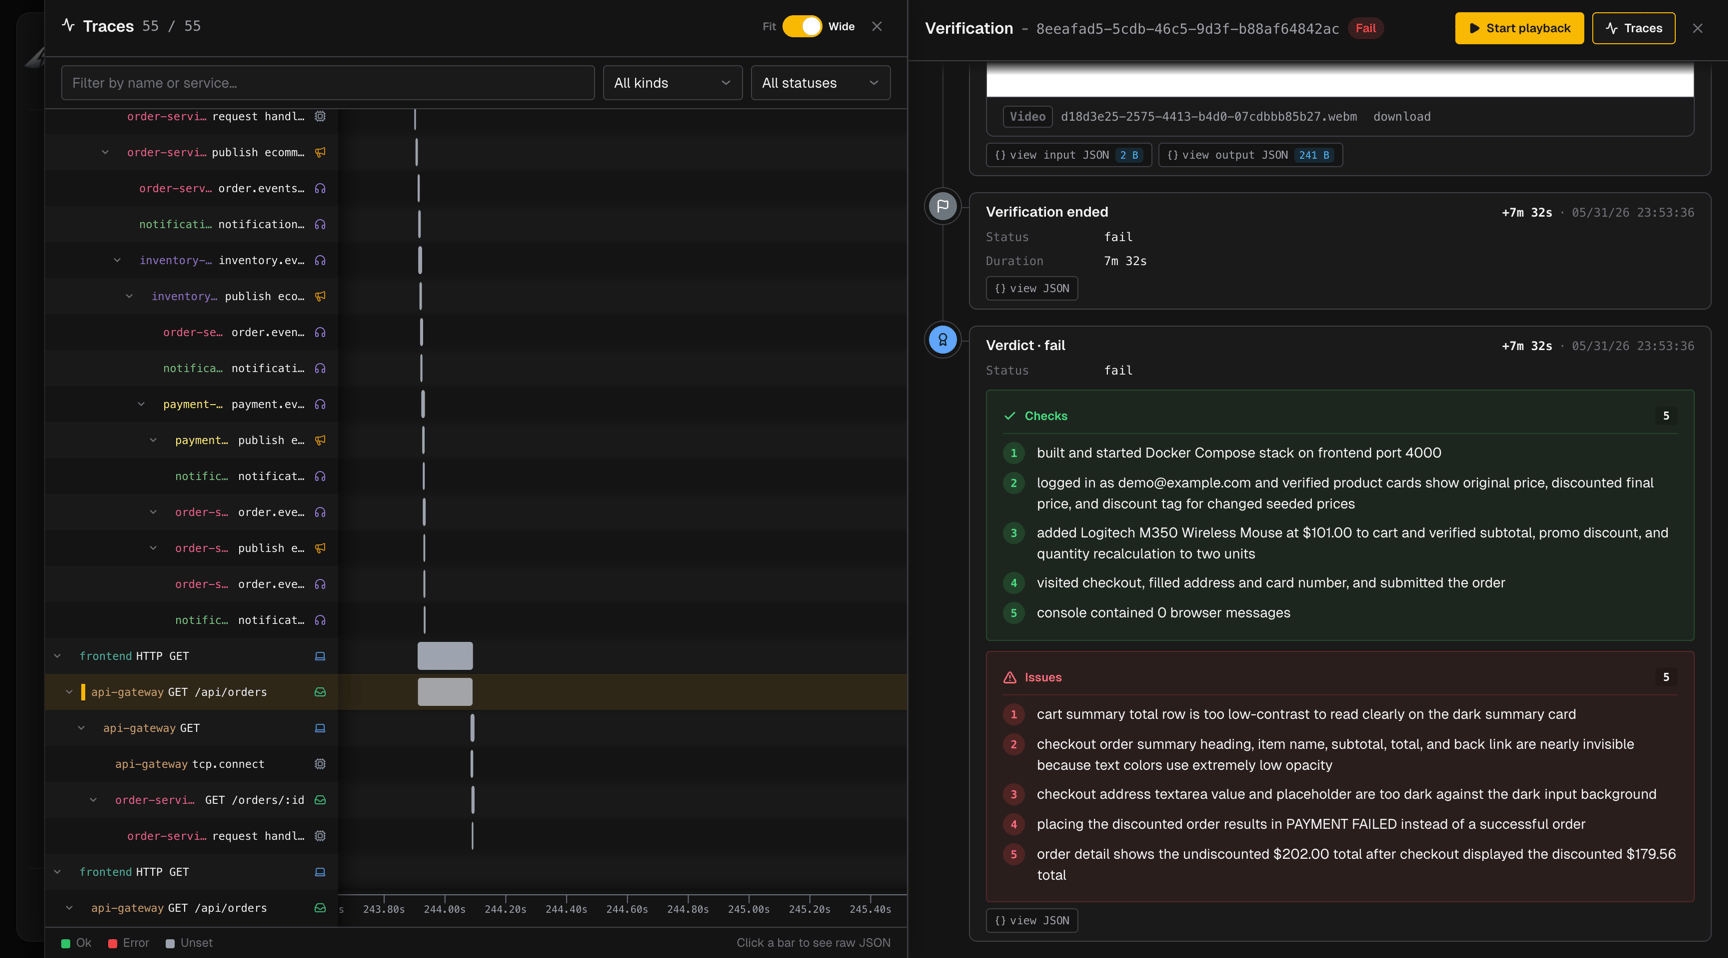 Click any span bar to open a JSON modal with the raw span data.