> ## Documentation Index
> Fetch the complete documentation index at: https://docs.ironbee.ai/llms.txt
> Use this file to discover all available pages before exploring further.
# Search
> Jump to a project with the command palette, or query your account's data with the query builder.
The console has two kinds of search:
* the **command palette**, for jumping to a project
* the **Search** page, for querying the data behind your projects
***
## Command palette
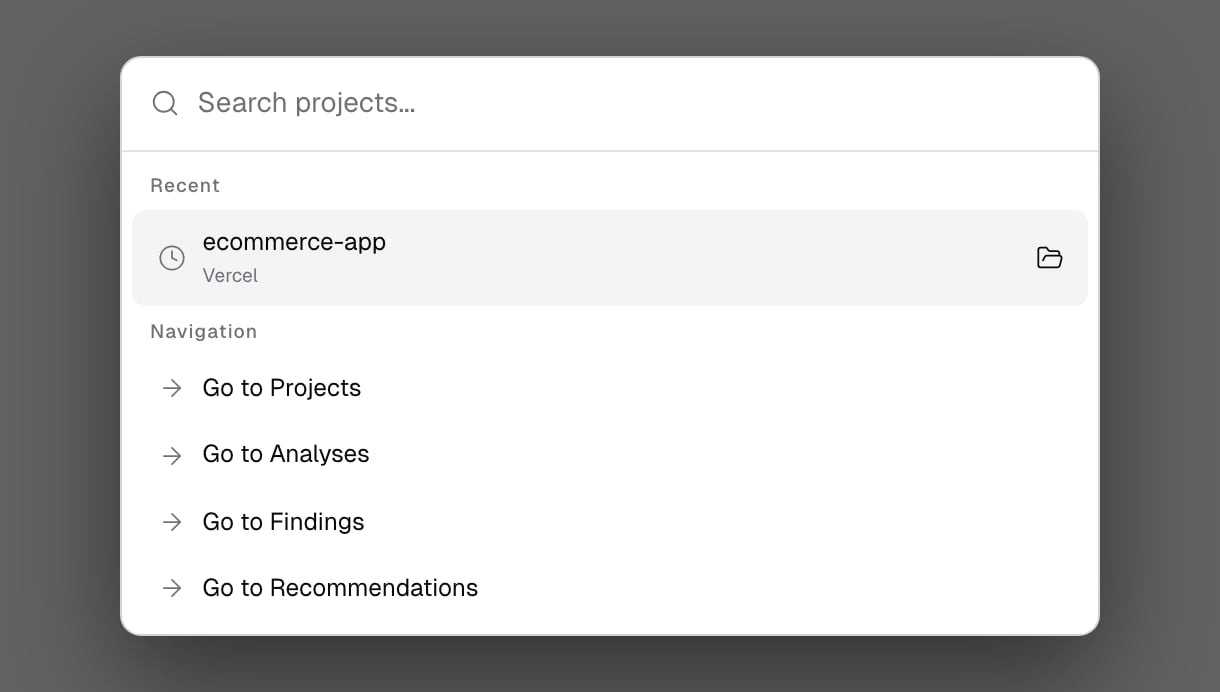
Press `⌘K` (or `Ctrl+K`), or click **Search projects or anything...** in the top bar.
* Type at least 3 characters to find a project by name. Picking one opens its [Verifications](/console/verifications) tab.
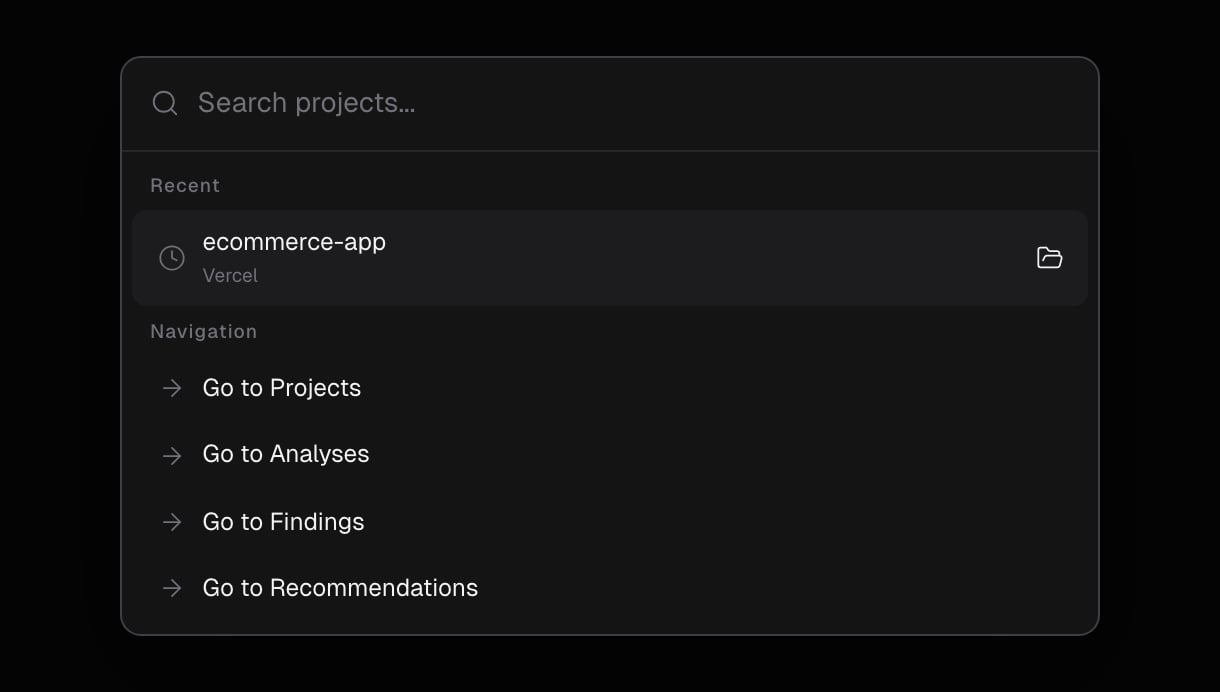
* With an empty query, the palette shows your **Recent** projects and **Navigation** shortcuts: **Go to Projects**, **Go to Analyses**, **Go to Findings** and **Go to Recommendations**.
 ***
## The Search page
Open **Search** in the sidebar to build a query over your account's data.
1. Under **Data Sources**, pick what to query: users, projects, sessions, verifications, fixes, findings, recommendations, pull requests or issues.
2. Choose **List** to see rows, or **Aggregate** to count and summarize.
3. Build the query:
* In **List** mode, pick the **Columns** to show.
* In **Aggregate** mode, add a **Group by** dimension and **Metrics** such as `COUNT(*)`.
* Add **Filters** to narrow the rows in either mode.
4. Pick a time range. It starts at **Last 7 Days**.
5. Click **Run query**.
***
## The Search page
Open **Search** in the sidebar to build a query over your account's data.
1. Under **Data Sources**, pick what to query: users, projects, sessions, verifications, fixes, findings, recommendations, pull requests or issues.
2. Choose **List** to see rows, or **Aggregate** to count and summarize.
3. Build the query:
* In **List** mode, pick the **Columns** to show.
* In **Aggregate** mode, add a **Group by** dimension and **Metrics** such as `COUNT(*)`.
* Add **Filters** to narrow the rows in either mode.
4. Pick a time range. It starts at **Last 7 Days**.
5. Click **Run query**.
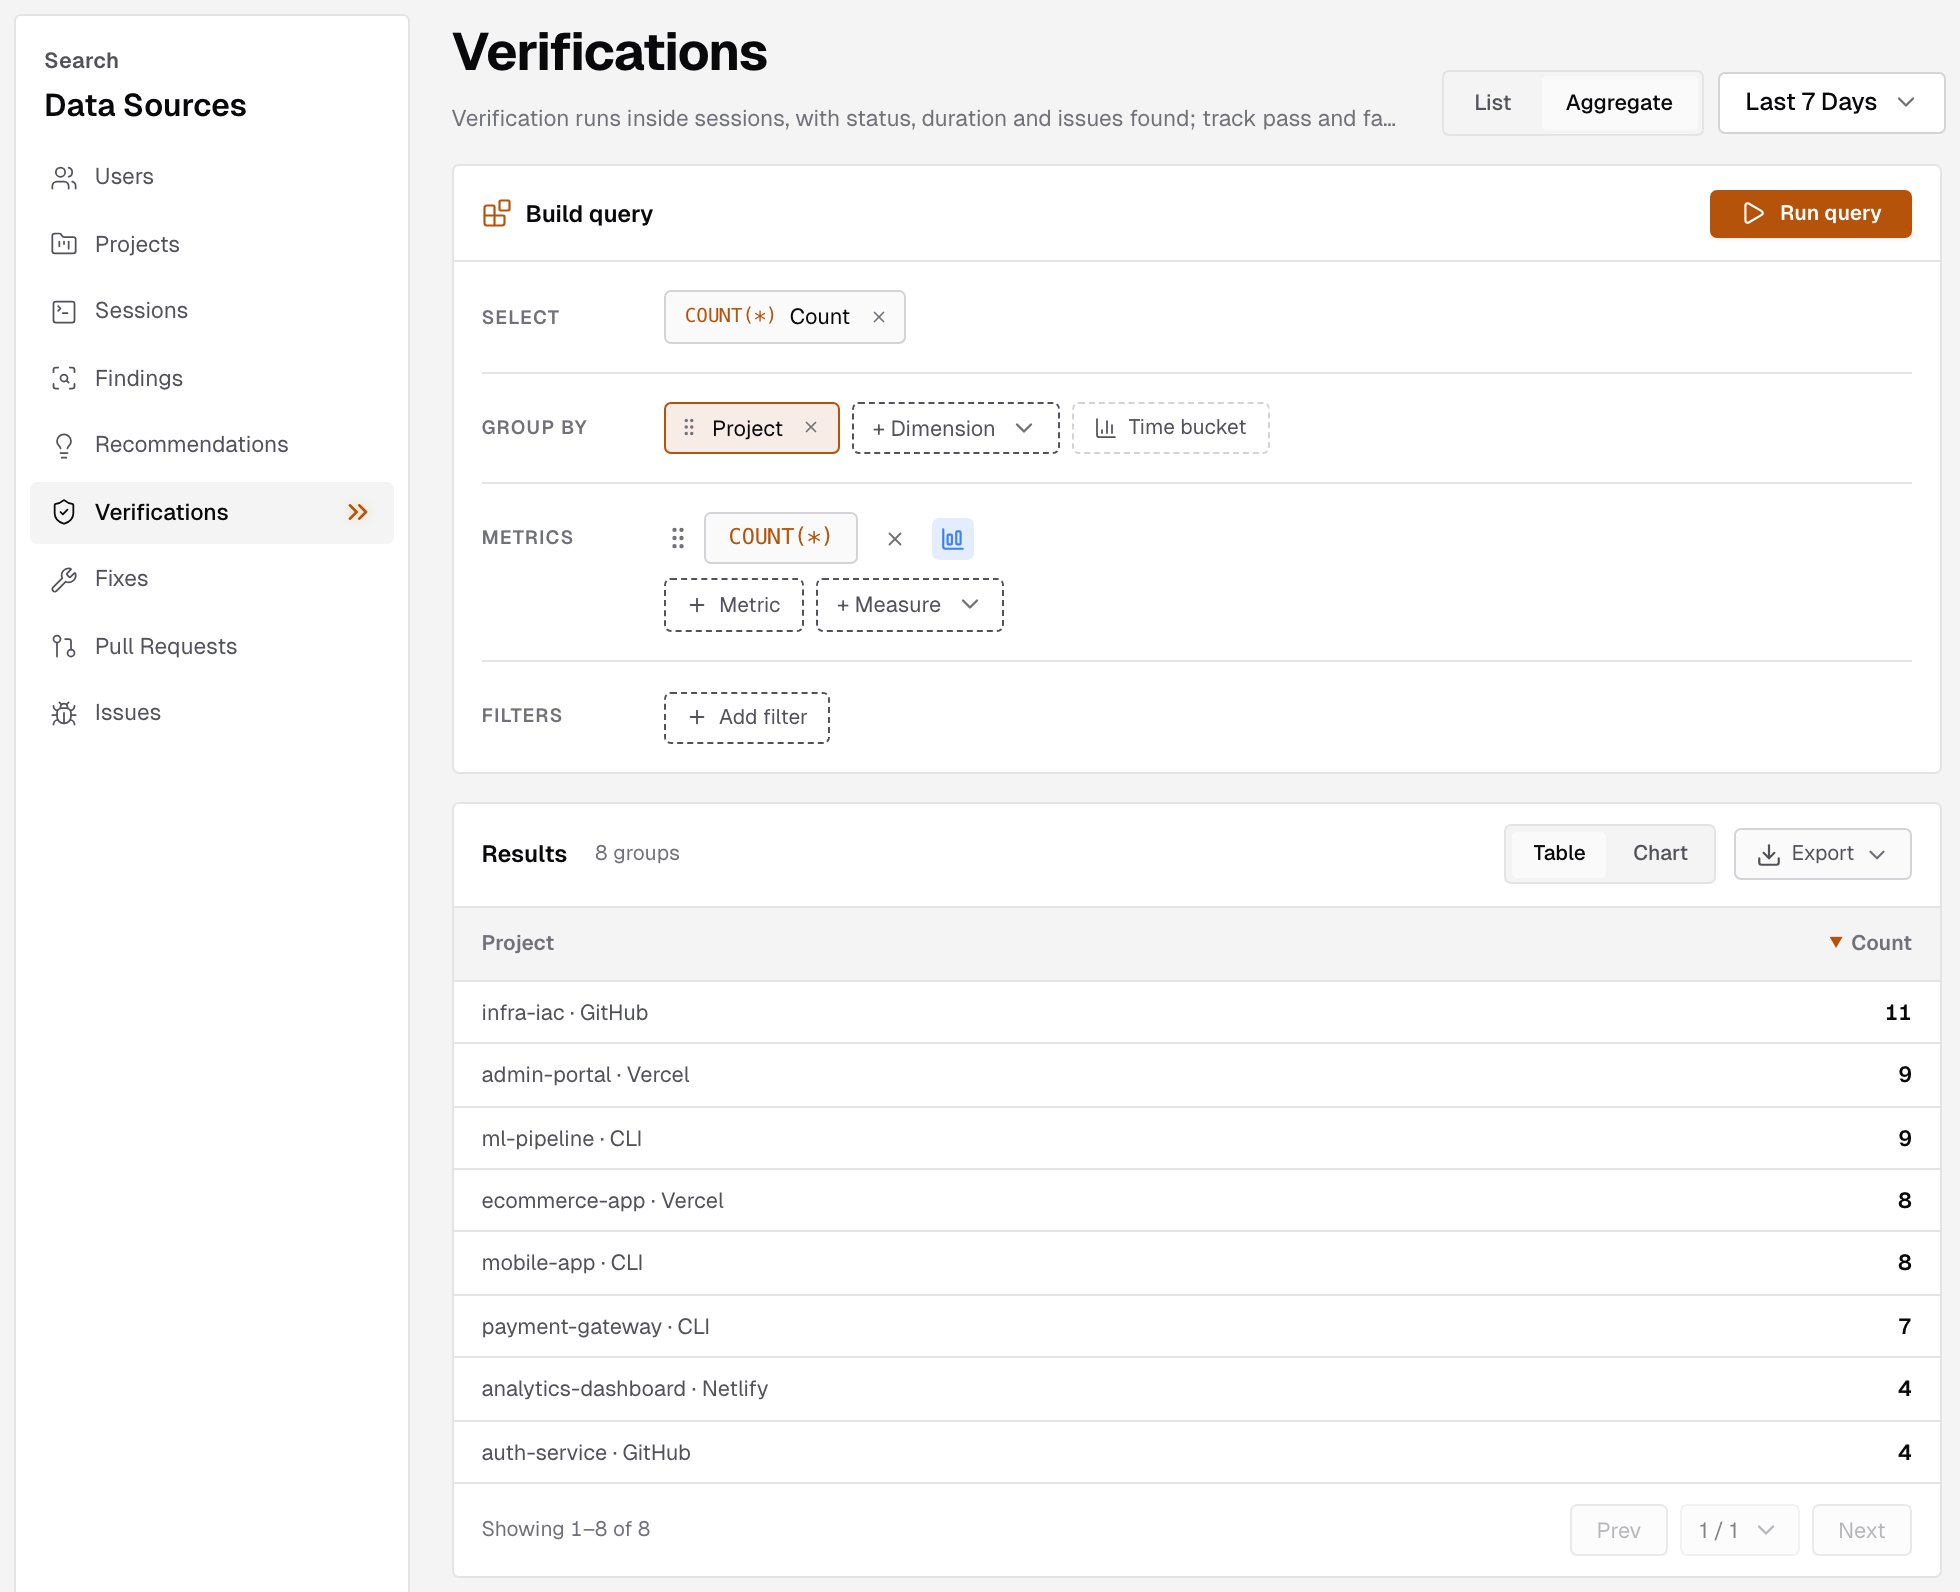
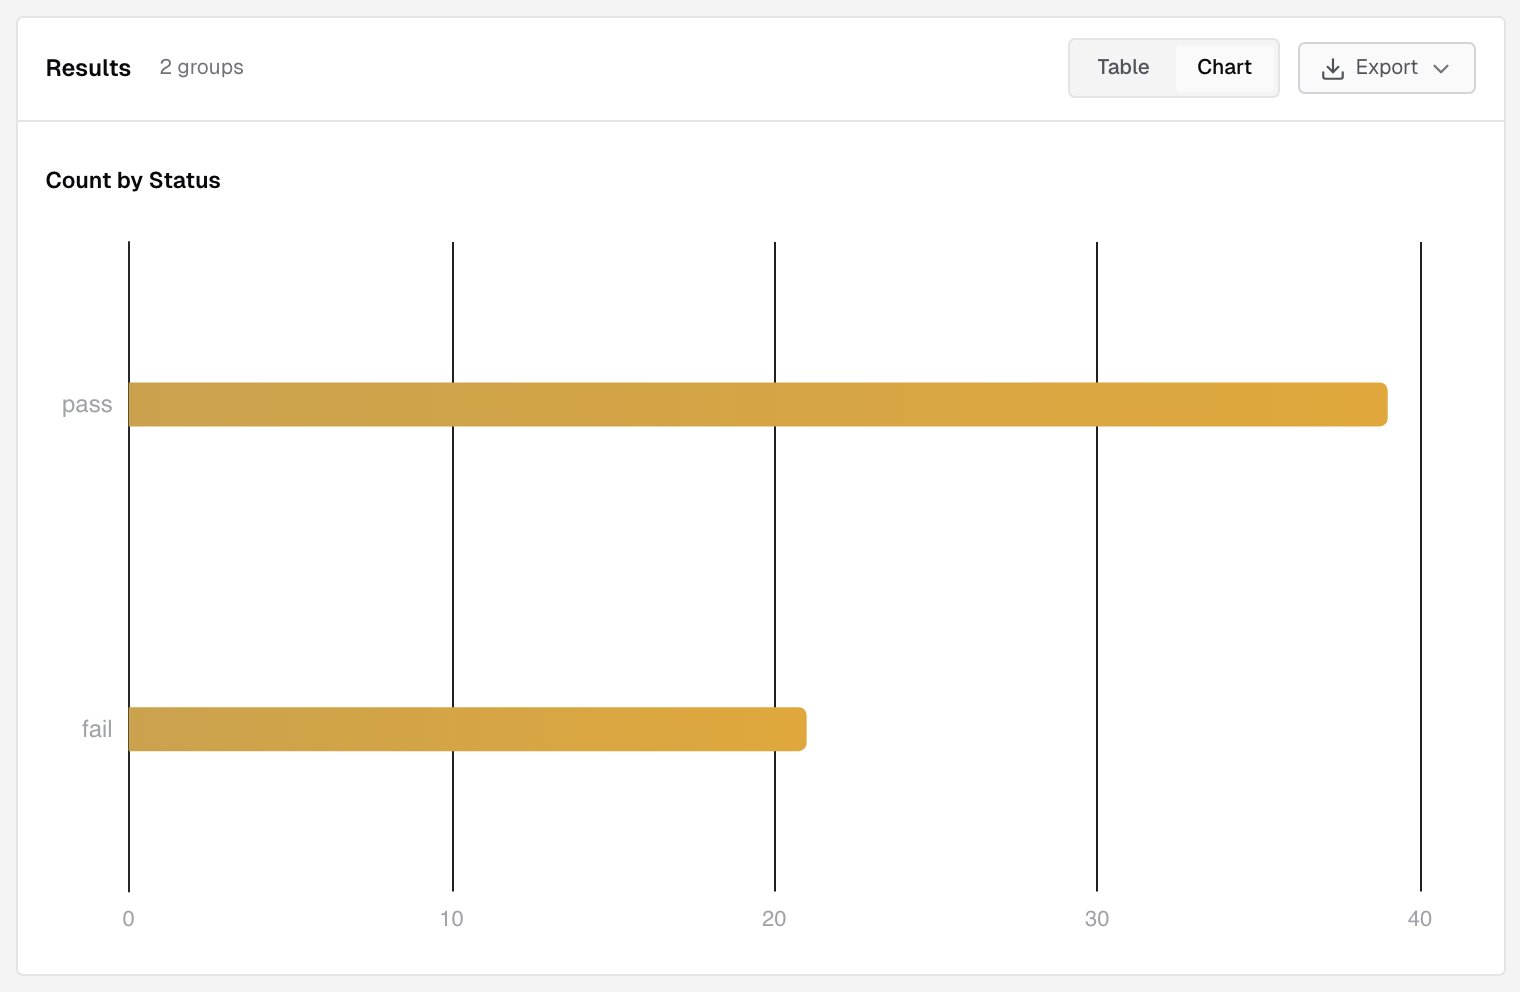
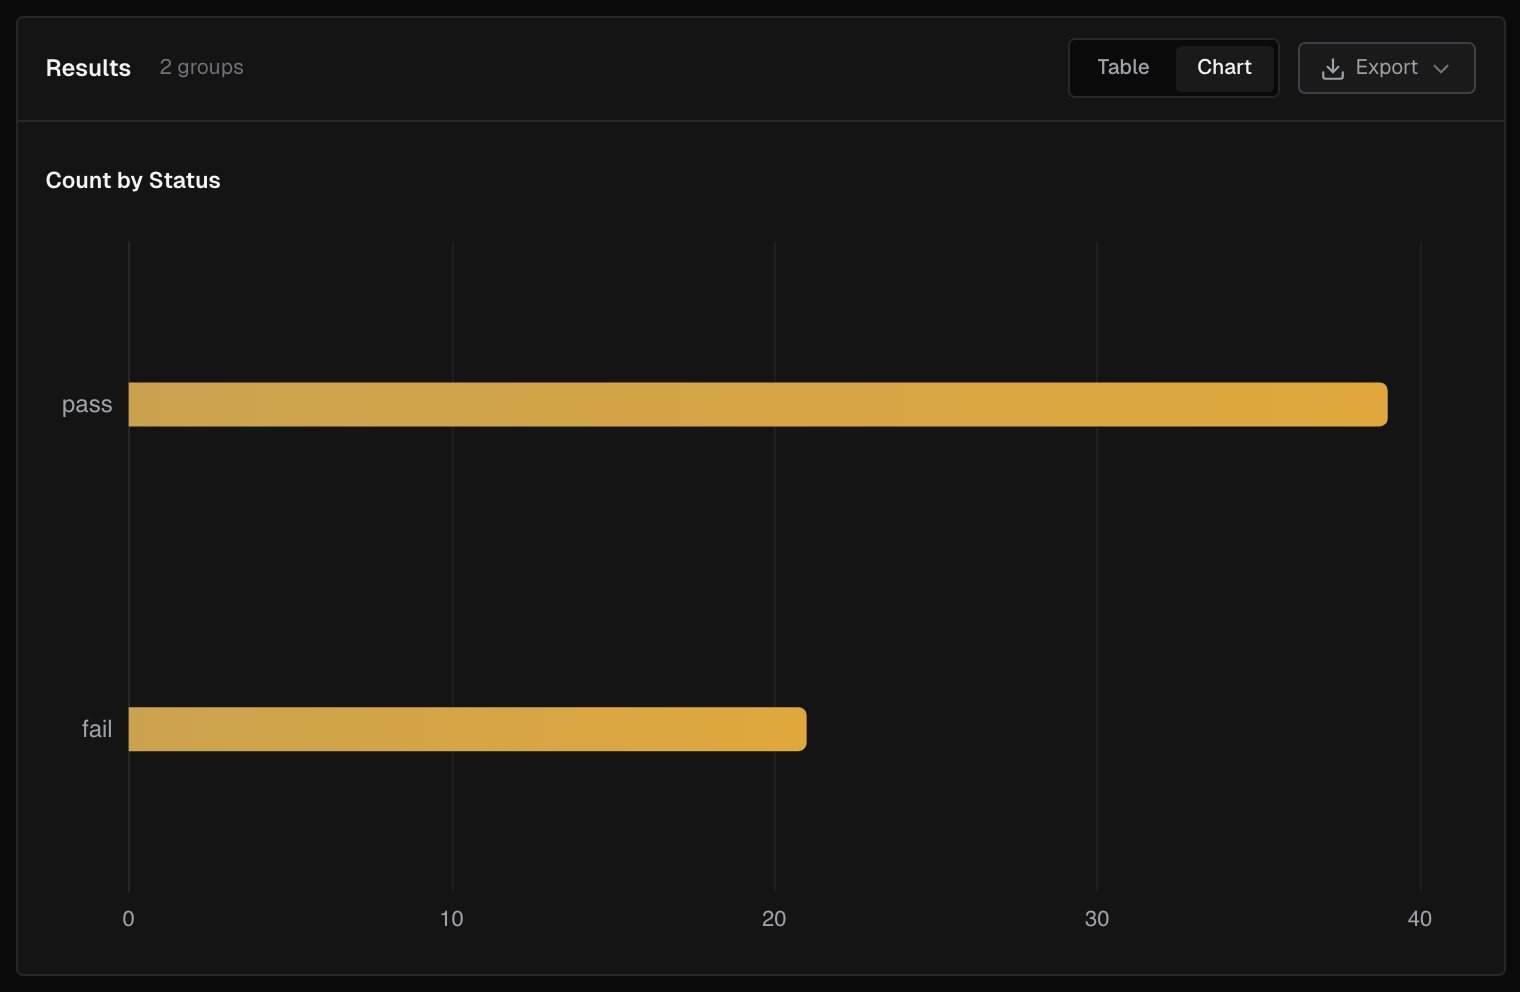
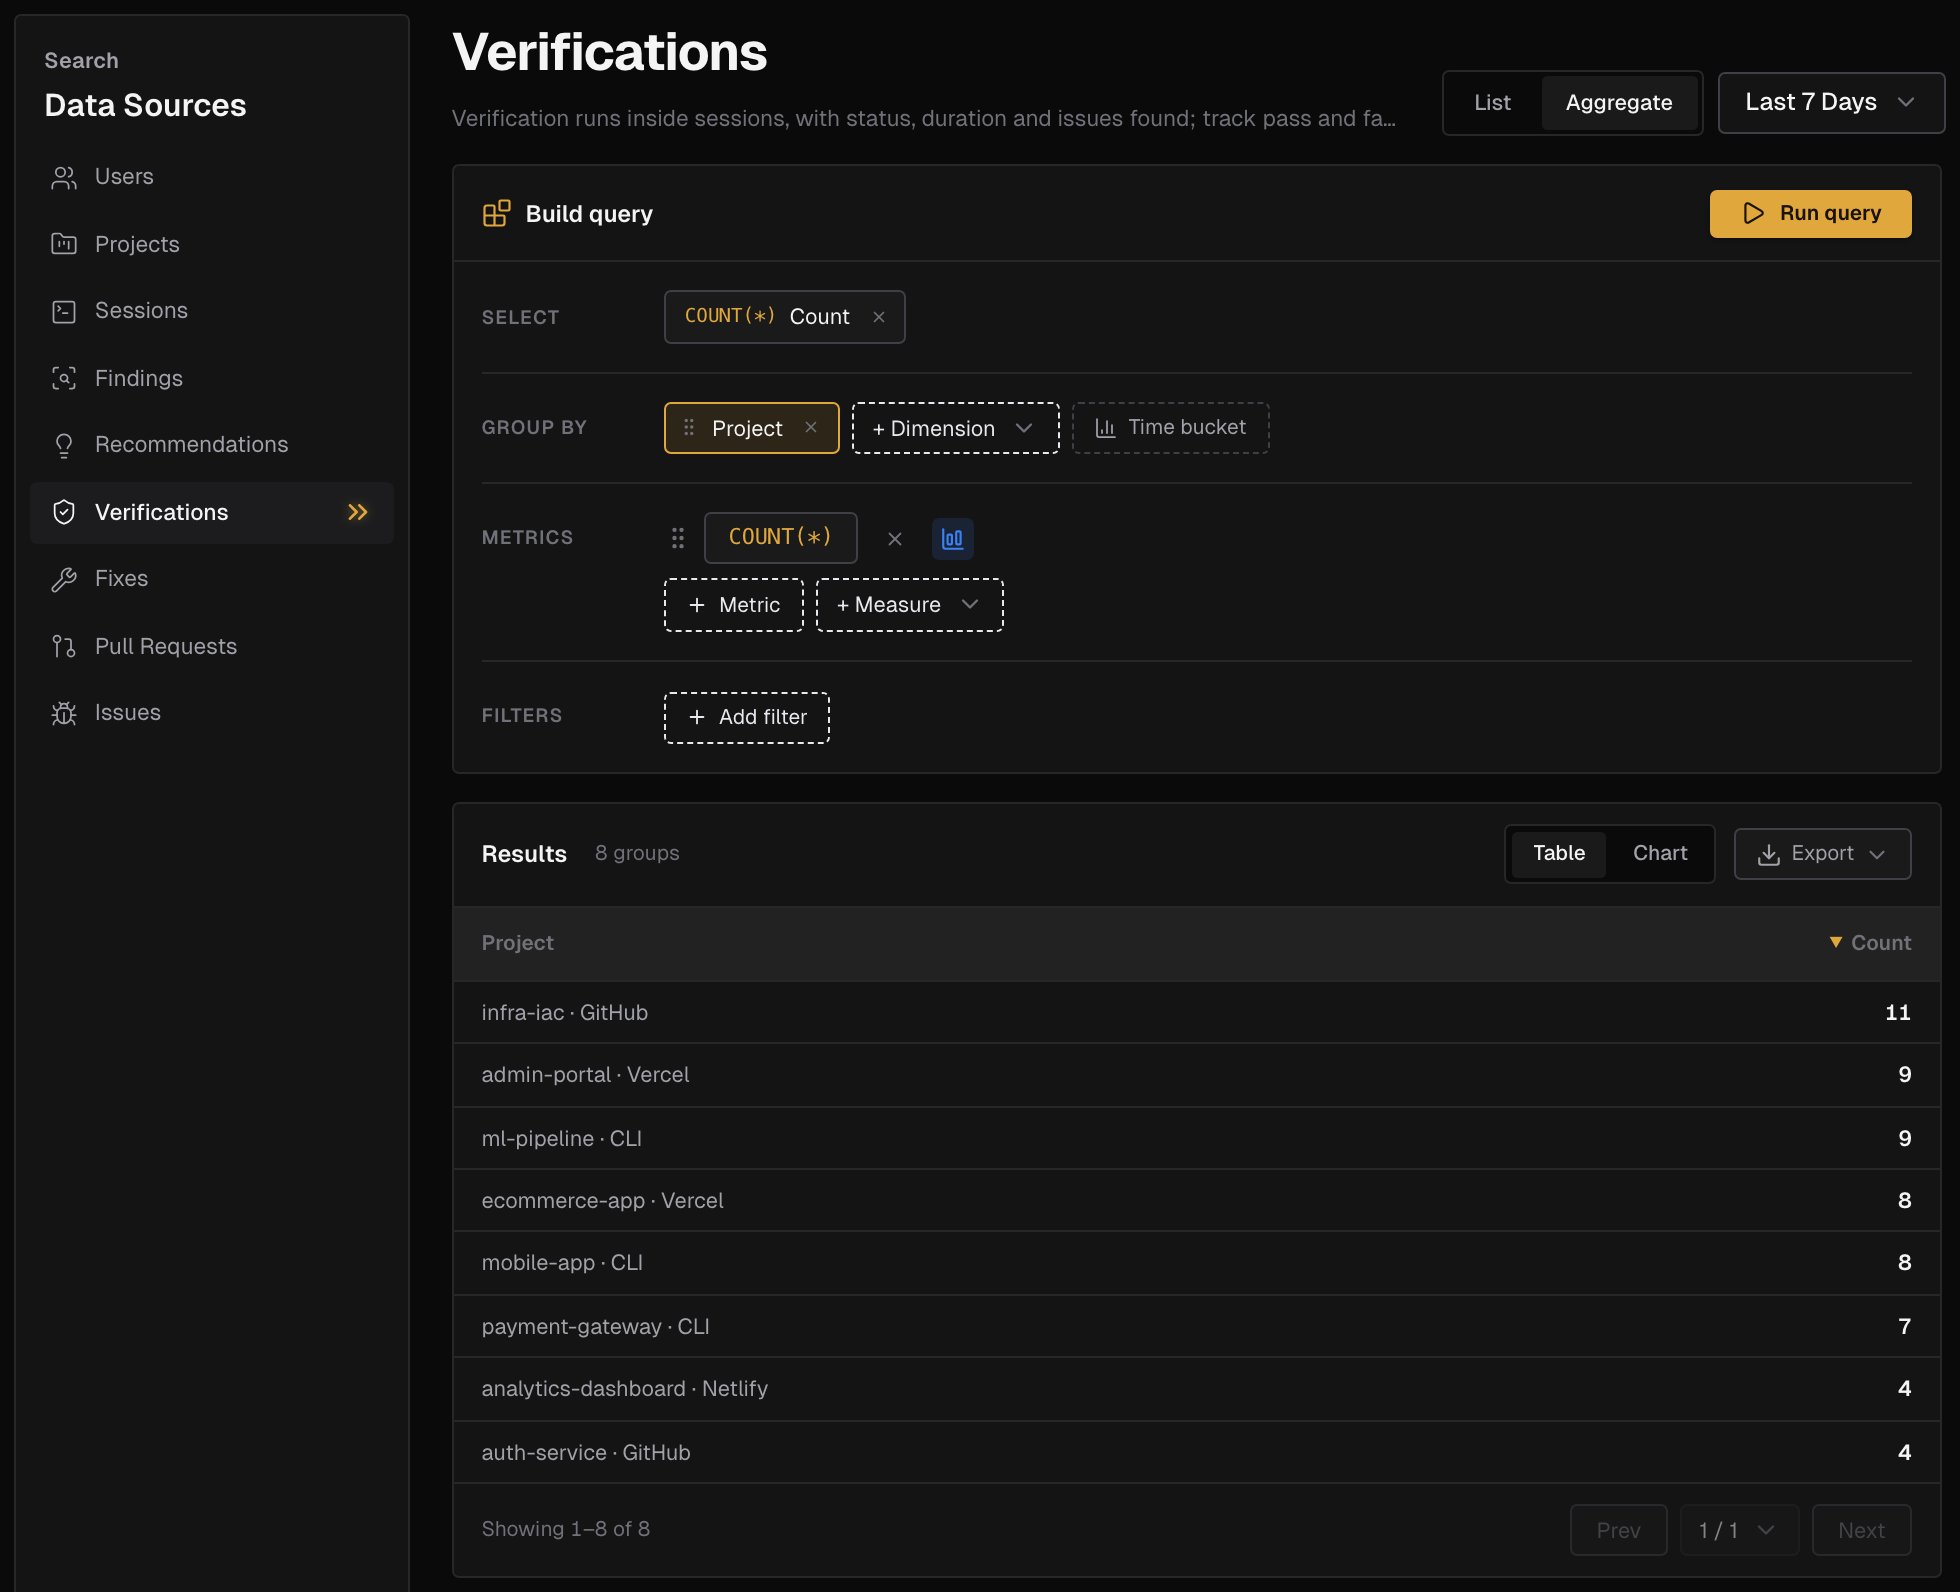 The **Results** show as a **Table**. An **Aggregate** query that groups by one dimension, by a **Time bucket**, or by both can also show as a **Chart**. Click **Export** to download the results as **CSV** or **PDF**.
 ***
## Related pages
Every project with its recent runs.
Every verification run of a project.
***
## Related pages
Every project with its recent runs.
Every verification run of a project.