> ## Documentation Index
> Fetch the complete documentation index at: https://docs.ironbee.ai/llms.txt
> Use this file to discover all available pages before exploring further.
# Projects
> Organize your codebases and track verification health at a glance.
A **project** in IronBee maps to a codebase. When you run `ironbee install` in a directory, that directory is associated with a project and all session data flows there automatically.
 ## The projects page
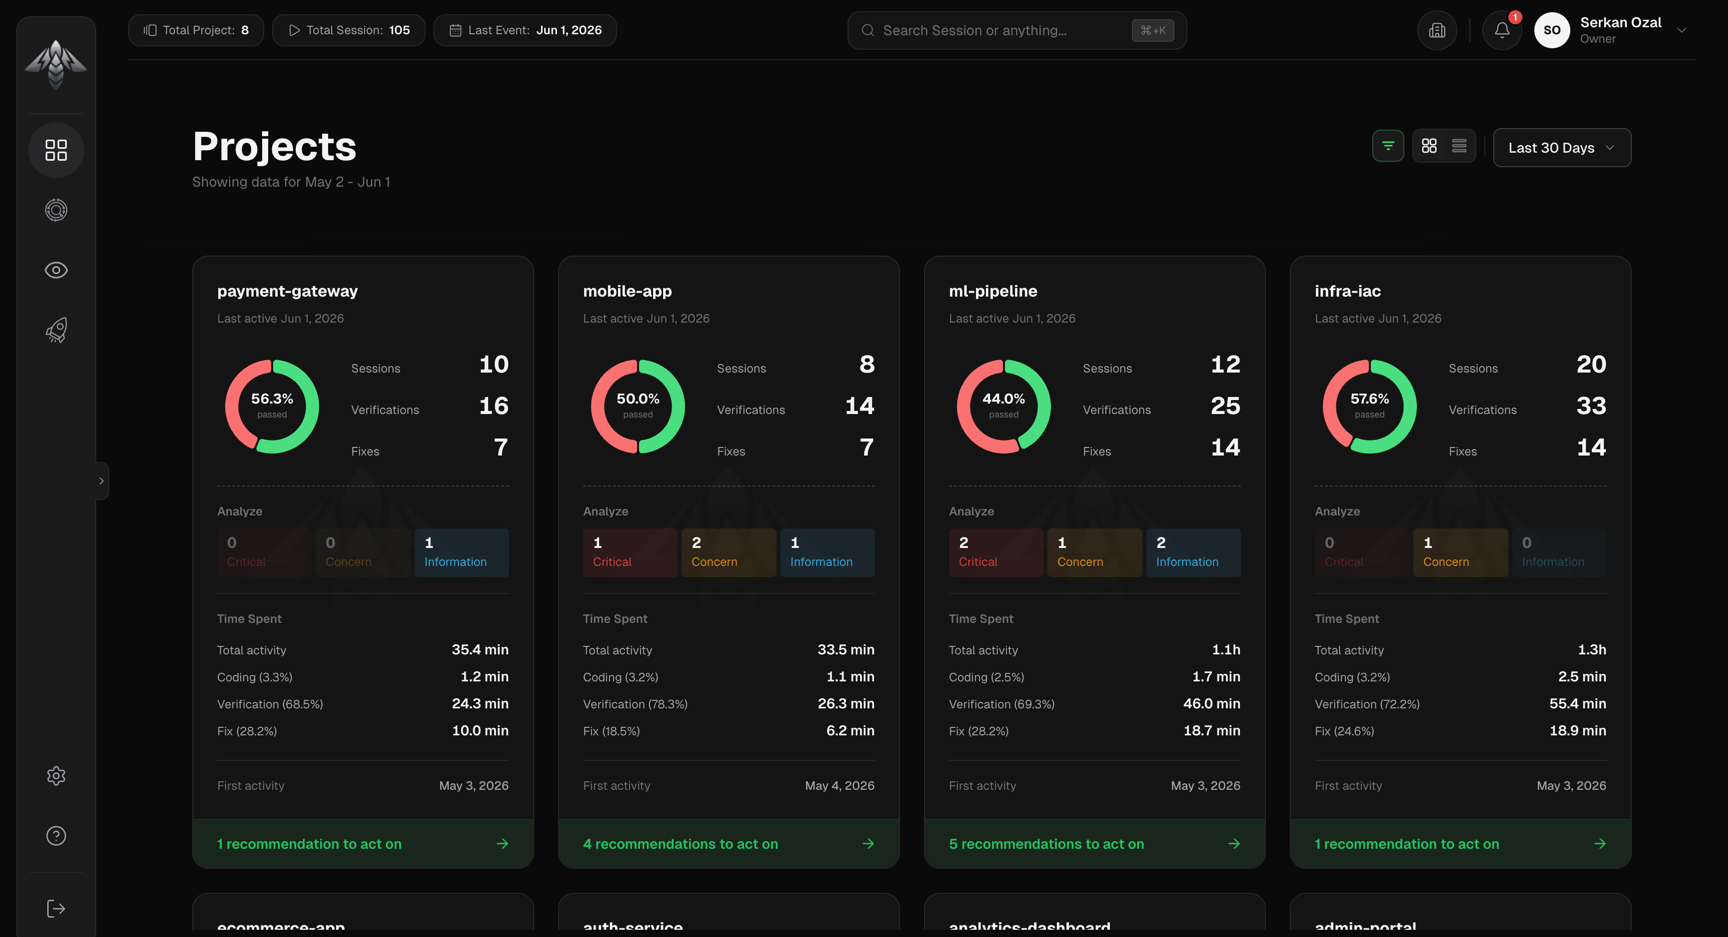
The projects page is the home screen of the IronBee Console. It shows every project your account has access to. Use the **date filter** in the page header to scope all metrics to a specific time range.
## Quick Search
## The projects page
The projects page is the home screen of the IronBee Console. It shows every project your account has access to. Use the **date filter** in the page header to scope all metrics to a specific time range.
## Quick Search
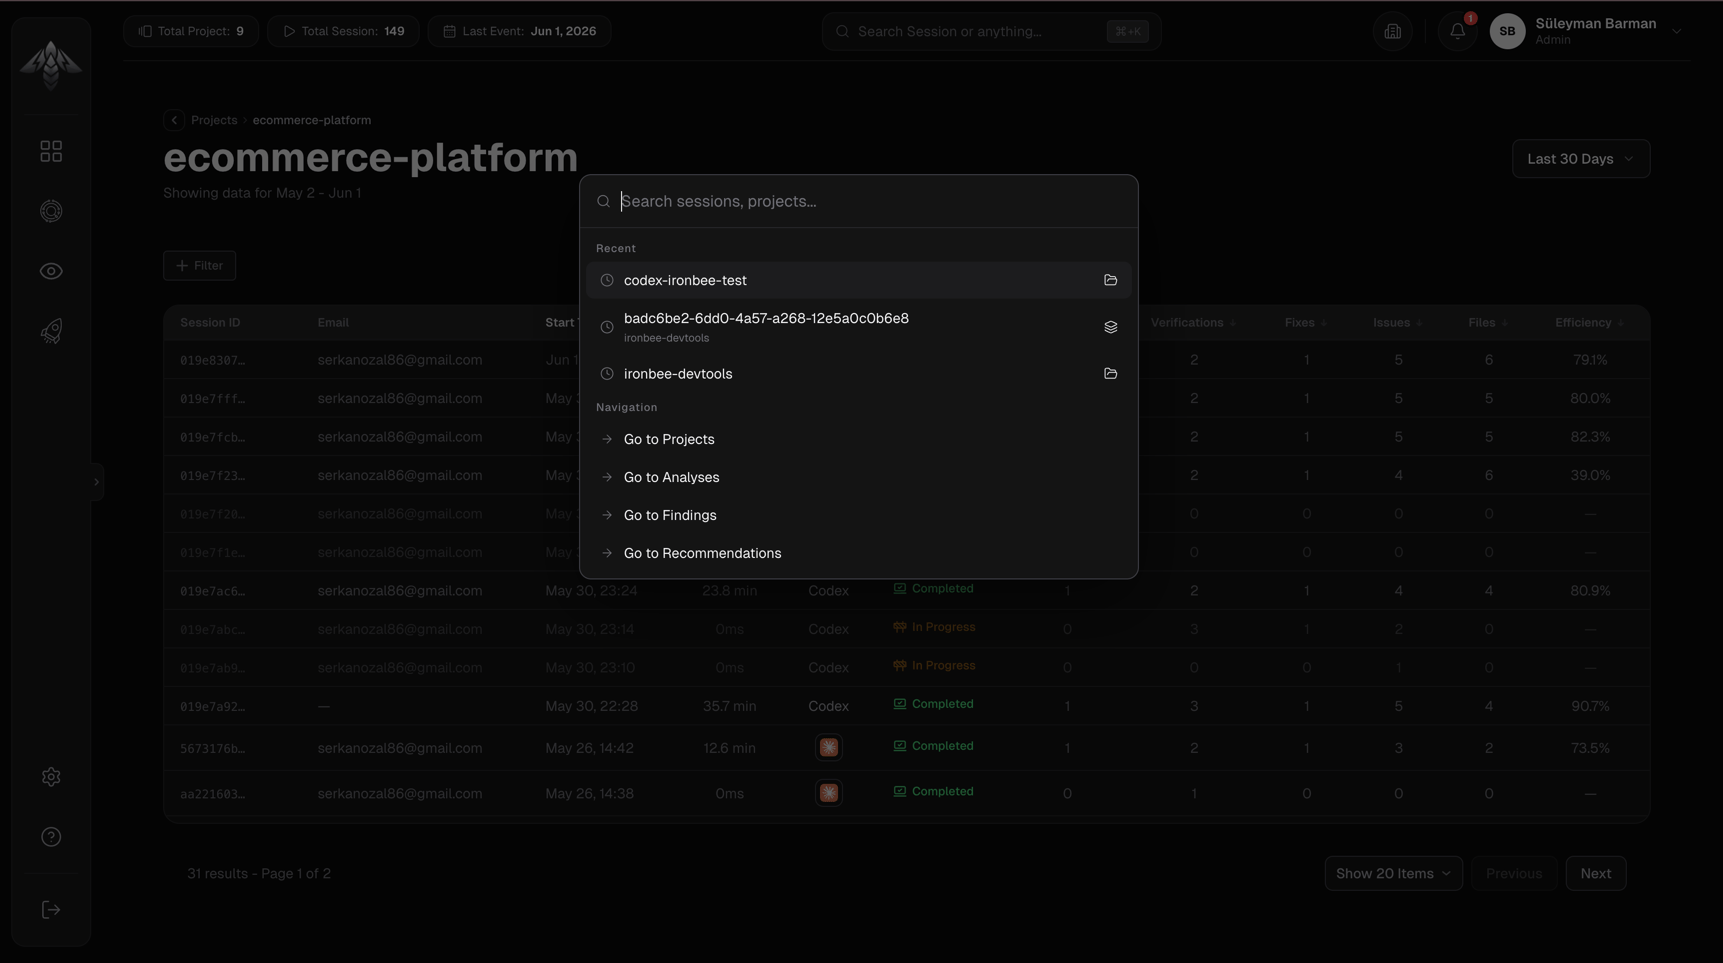 Use the search bar at the top of the console to jump directly to any project, session, or finding by ID or keyword. Quick Search returns results across all projects your account has access to.
## View modes
Toggle between **Card view** and **List view** using the toolbar controls. Your preference is saved automatically.
### Card view
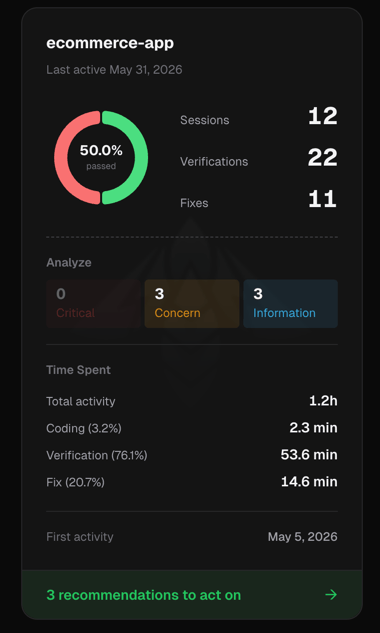
* **Project name**
* **Last active date**
* **Pass rate donut chart**, center label shows the percentage of verifications that passed; hover for a passed/failed count breakdown
* **KPI stack**, Sessions, Verifications, Fixes counts
* **Time breakdown**: Total activity time split into Coding, Verification, and Fix phases with percentages
* **Findings tiles**, Critical, Concern, and Notice finding counts (click to go directly to the filtered Findings page)
* **Recommendations button**, shows count of active recommendations (click to open the Recommendations page)
Use the search bar at the top of the console to jump directly to any project, session, or finding by ID or keyword. Quick Search returns results across all projects your account has access to.
## View modes
Toggle between **Card view** and **List view** using the toolbar controls. Your preference is saved automatically.
### Card view
* **Project name**
* **Last active date**
* **Pass rate donut chart**, center label shows the percentage of verifications that passed; hover for a passed/failed count breakdown
* **KPI stack**, Sessions, Verifications, Fixes counts
* **Time breakdown**: Total activity time split into Coding, Verification, and Fix phases with percentages
* **Findings tiles**, Critical, Concern, and Notice finding counts (click to go directly to the filtered Findings page)
* **Recommendations button**, shows count of active recommendations (click to open the Recommendations page)
 ### List view
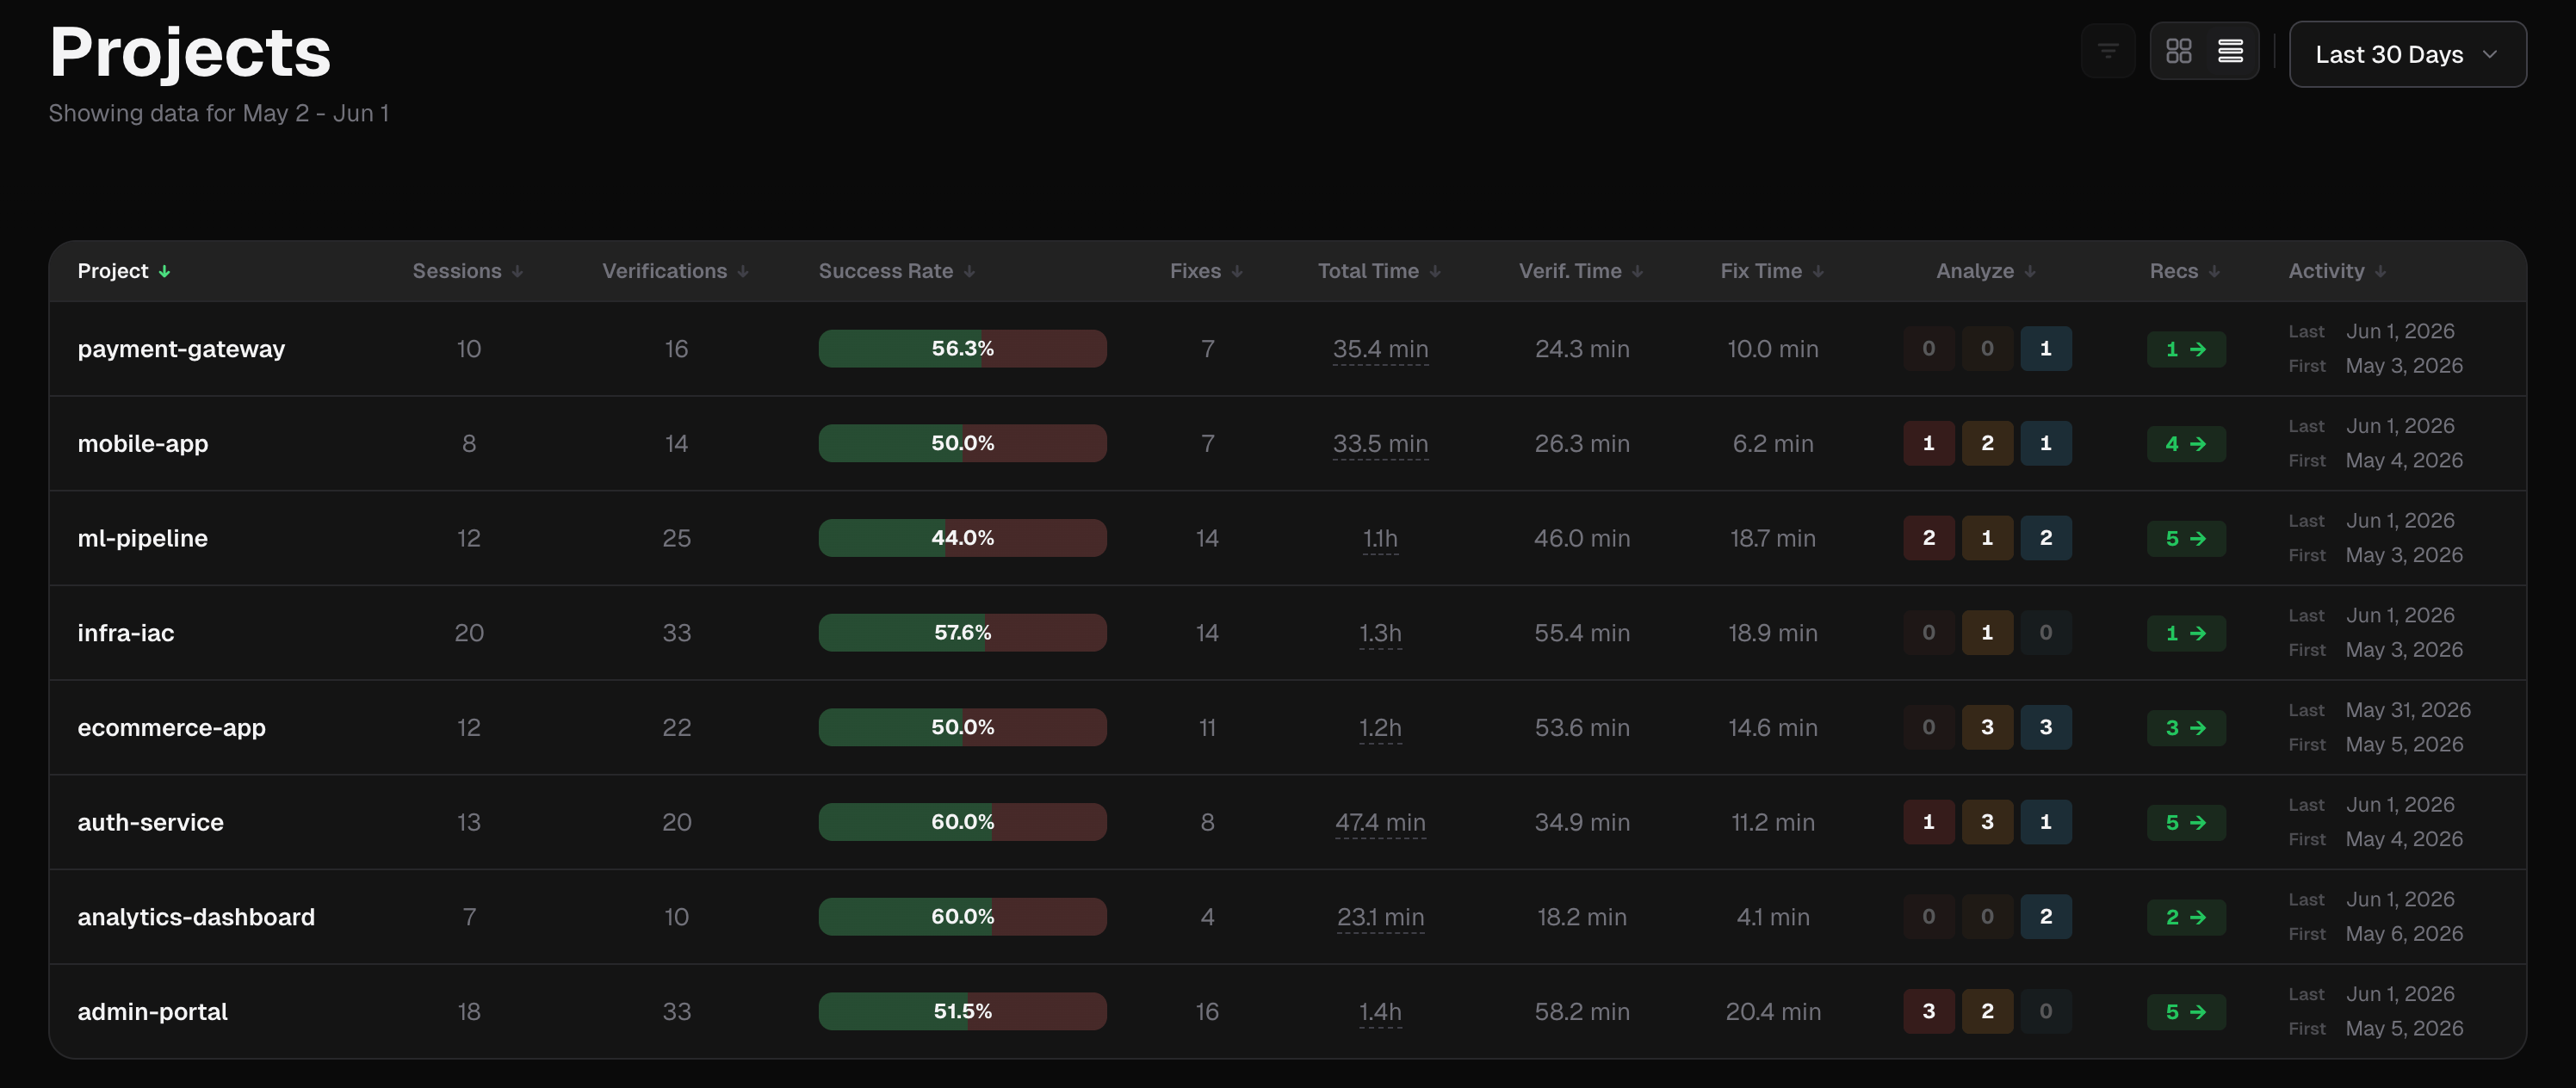
The table has the following columns (all sortable by clicking the header):
### List view
The table has the following columns (all sortable by clicking the header):
 | Column | Description |
| ------------- | --------------------------------------------------------------- |
| Project | Project name |
| Sessions | Total session count |
| Verifications | Total verification cycle count |
| Success Rate | Percentage of verifications that passed, with a bar chart |
| Fixes | Total fix attempts |
| Total Time | Combined coding + verification + fix time (hover for breakdown) |
| Verif. Time | Time spent in verification cycles |
| Fix Time | Time spent on fixes |
| Analyze | Critical / Concern / Notice finding counts (clickable) |
| Recs | Active recommendations count (clickable) |
| Activity | Last and first activity dates |
## Sorting
In card view, use the **Sort dropdown** in the toolbar to sort by: Project Name, Sessions, Verifications, Success Rate, Fixes, Total Time, Verif. Time, Fix Time, or Last Activity. In list view, click any column header to sort.
## Creating a project
Projects are created automatically the first time a session is started in a directory that has IronBee installed. No manual setup is required in the console.
## Next steps
Browse and filter all sessions for a project.
View AI-powered insights across your project.
| Column | Description |
| ------------- | --------------------------------------------------------------- |
| Project | Project name |
| Sessions | Total session count |
| Verifications | Total verification cycle count |
| Success Rate | Percentage of verifications that passed, with a bar chart |
| Fixes | Total fix attempts |
| Total Time | Combined coding + verification + fix time (hover for breakdown) |
| Verif. Time | Time spent in verification cycles |
| Fix Time | Time spent on fixes |
| Analyze | Critical / Concern / Notice finding counts (clickable) |
| Recs | Active recommendations count (clickable) |
| Activity | Last and first activity dates |
## Sorting
In card view, use the **Sort dropdown** in the toolbar to sort by: Project Name, Sessions, Verifications, Success Rate, Fixes, Total Time, Verif. Time, Fix Time, or Last Activity. In list view, click any column header to sort.
## Creating a project
Projects are created automatically the first time a session is started in a directory that has IronBee installed. No manual setup is required in the console.
## Next steps
Browse and filter all sessions for a project.
View AI-powered insights across your project.